
You probably know this pattern. An analyst asks for a running total, a product manager wants month-over-month change, and your first draft turns into nested subqueries plus a self-join that nobody wants to maintain. Then your AI team asks for sequence-aware user events for training data, and the same old query patterns start to crack.
That's where window functions SQL becomes one of the most useful tools in your stack. It lets you calculate across related rows without losing the original row detail. For business intelligence work, that means cleaner rankings, rolling averages, and change detection. For modern AI and machine learning data preparation, it means building ordered event streams, session boundaries, and historical features directly in SQL before the data ever reaches Python, Spark, or a feature store.
TLDR Your Guide to Window Functions
If you need the short version, here it is.
- Window functions calculate across related rows while keeping each original row visible. That's the core difference from
GROUP BY, which merges rows into grouped output. This behavior is built around the mandatoryOVER()clause and is standardized in SQL:2016 after window functions were formally introduced in SQL:1998. - Start with three functions first.
ROW_NUMBER()is the workhorse for deduplication and ranking.LAG()is the simplest way to compare a row with the previous one.SUM() OVER(...)is the pattern you'll use for running totals and rolling metrics. - Use window functions when you need detail and summary at the same time. That includes top-N by category, transaction-level running totals, state changes, and time-based trend analysis.
- They're widely supported and practical in production. Window functions are implemented in 95% of major relational database systems in the verified data provided, which is a big reason they show up so often in analytics engineering and interview loops.
- For AI and ML teams, they matter more than most tutorials admit. Ordered user histories, prior-event comparisons, and rolling behavior features often start as SQL windows before they become training examples.
Practical rule: If
GROUP BYremoves too much detail, reach for a window function instead.
Who This Guide Is For
This guide is for people who already know SQL basics and need better patterns for real workloads.
If you're a CTO, Head of Engineering, or Staff Engineer, you'll care about maintainability, query performance, and whether your team is solving analytics problems with readable SQL instead of fragile query chains.
If you're a founder or product lead, you'll care about what these patterns enable. Think user timelines, cohort reporting, fraud signals, support metrics, or feature engineering for AI products.
If you manage data engineers, analytics engineers, BI developers, or MLOps teams, this is one of those skills that separates basic reporting from production-grade analytics. It's also a hiring signal. In the verified data, a 2024 StrataScratch survey says 78% of senior data engineers and 85% of SQL interview prep candidates report that window functions are among the top 3 most critical skills for job readiness.
You don't need advanced math. You do need comfort with SELECT, filtering, joins, and grouped aggregates.
The Core Framework of a Window Function
A window function has one job. It looks at a row, then also looks around that row according to rules you define.
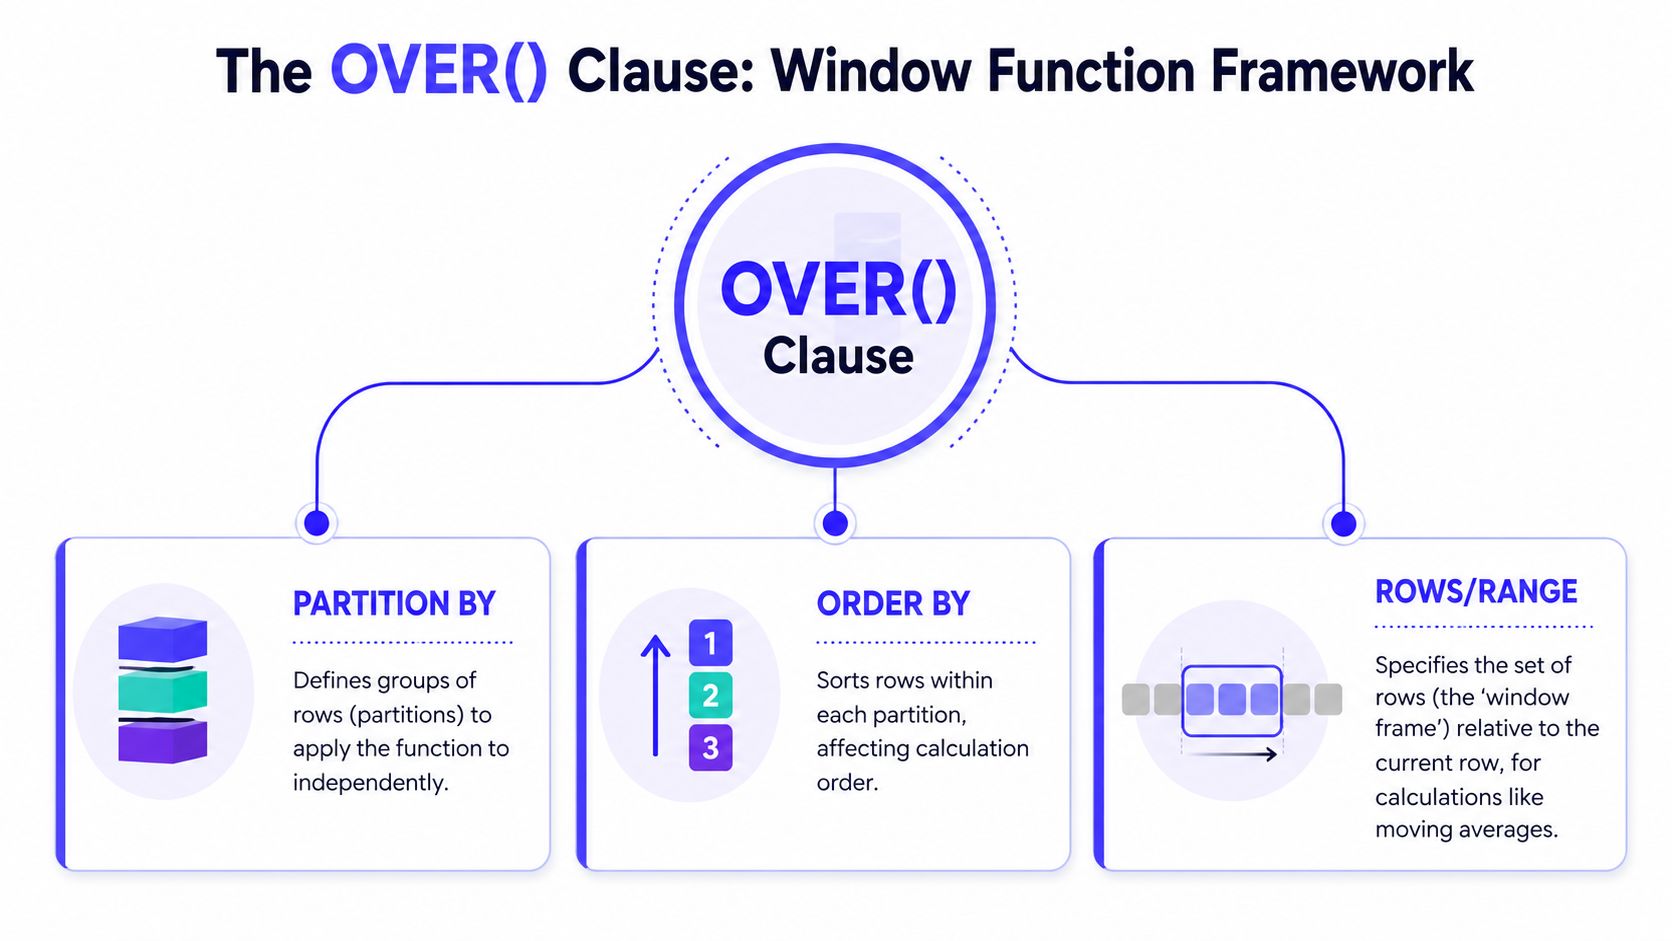
The rules live inside OVER(). If you remember nothing else, remember this: the function does the calculation, and OVER() tells SQL which rows are allowed into that calculation.
Think in folders, sort order, and a moving viewport
A useful analogy is a file cabinet.
PARTITION BYcreates folders. Each folder is an independent group.ORDER BYsorts files inside each folder.ROWSorRANGEdefines the visible slice of files for the current calculation.
That's why window functions feel more expressive than plain aggregates. You're not just grouping data. You're defining context.
Here's a simple running total by department:
SELECTdept,sale_date,amount,SUM(amount) OVER (PARTITION BY deptORDER BY sale_date) AS running_totalFROM sales;That pattern captures the key idea cited in GeeksforGeeks on SQL window functions: window functions allow for simultaneous computation of aggregate-level metrics and row-level granularity, a key distinction from GROUP BY which merges rows. This enables calculating metrics like SUM() OVER (PARTITION BY dept ORDER BY date) to get running totals per department while keeping individual transaction rows.
Why GROUP BY feels similar, but isn't
GROUP BY and window functions both work with sets of rows. That's where the confusion starts.
With GROUP BY, SQL collapses many rows into fewer rows. If you group sales by department, you no longer see each transaction. With a window function, each transaction stays in the result, and the department-level or sequence-level calculation appears alongside it.
That difference matters in production because analysts often need both views at once. They want the line item and the context.
Window functions keep the row and add context.
GROUP BYreplaces the row with a summary.
There's another important rule. Window functions can't be used inside a GROUP BY clause, and the verified data also notes they can't be used in the same query as standard GROUP BY aggregations in the straightforward way many people first attempt. In practice, if you need both, you usually stage the grouped result in a subquery or common table expression, then apply the window in an outer query.
What a frame actually does
The frame is the part often skipped, then regretted later.
If you define ORDER BY, you often also need to think about which ordered rows are included. For example:
AVG(amount) OVER (PARTITION BY deptORDER BY sale_dateROWS BETWEEN 2 PRECEDING AND CURRENT ROW) AS moving_avg_3That means: for each row, average the current row and the two rows before it within the same partition.
This matters for business logic. A cumulative total, a 3-row moving average, and a month-to-date total may all use the same measure but very different frames.
A quick walkthrough helps if you want to see the syntax in motion:
Practical Example 1 Ranking and Deduplication
Deduplication is where many teams first get real value from window functions. Logs duplicate. APIs retry. Mobile apps resend events. If you can rank rows inside a logical group, you can keep the right record and drop the rest.
According to the verified data from StrataScratch, ROW_NUMBER() is the most frequently used window function, applied in 65% of deduplication and ranking tasks faced by data engineers.
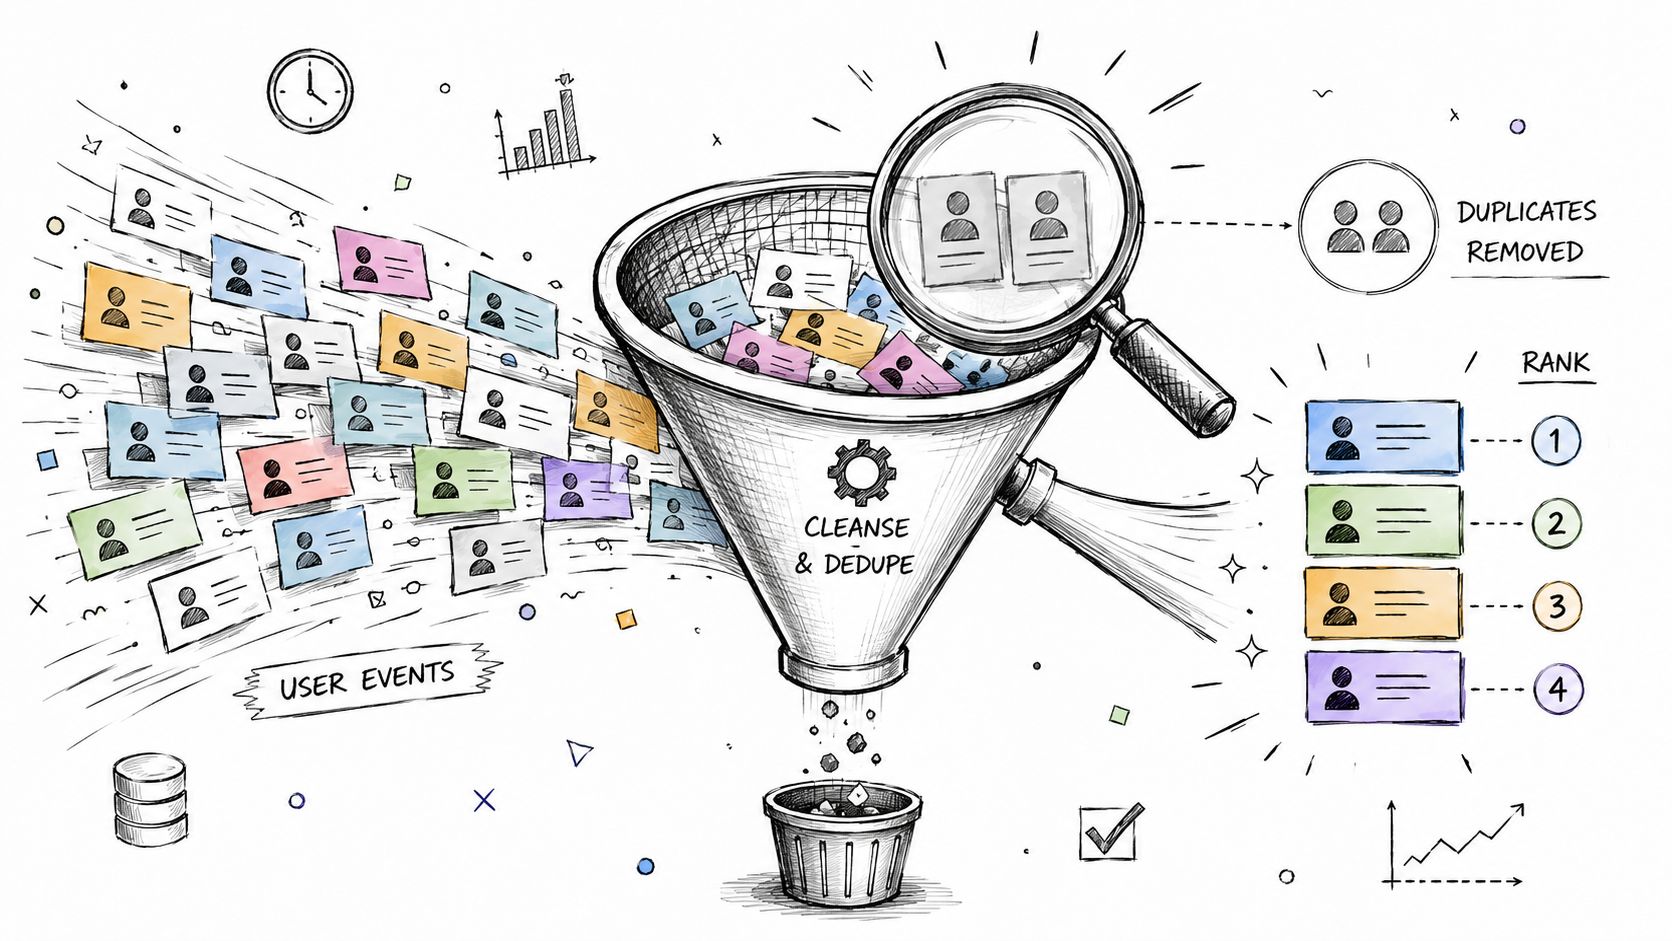
Mini case cleaning duplicate user events
Say you have an app_events table. A user clicks “start_trial,” but the mobile client retries after a flaky network hop. You now have duplicate events with the same user and action, recorded seconds apart.
You can mark the first event in each logical group like this:
SELECTuser_id,event_type,event_timestamp,ROW_NUMBER() OVER (PARTITION BY user_id, event_typeORDER BY event_timestamp) AS rnFROM app_events;If your deduplication rule is “keep the earliest event,” filter for rn = 1 in an outer query:
WITH ranked_events AS (SELECTuser_id,event_type,event_timestamp,ROW_NUMBER() OVER (PARTITION BY user_id, event_typeORDER BY event_timestamp) AS rnFROM app_events)SELECT *FROM ranked_eventsWHERE rn = 1;That's simple, auditable, and easy to extend. If your real rule is “keep the most recent successful event,” change the ORDER BY and maybe add a status column to the partitioning logic.
For teams building event pipelines in Python, this SQL-first cleanup pairs well with a broader ETL with Python workflow, especially when you want the warehouse to handle deduplication before downstream feature generation.
ROW_NUMBER() versus RANK() versus DENSE_RANK()
These three look similar until ties show up.
| Function | What it does | Tie behavior | Good fit |
|---|---|---|---|
ROW_NUMBER() | Assigns a unique sequence | No ties, every row gets a unique number | Deduplication, picking one row |
RANK() | Assigns position with gaps | Tied rows share rank, next rank skips | Competition-style ranking |
DENSE_RANK() | Assigns position without gaps | Tied rows share rank, next rank does not skip | Top-N category lists |
If you want the top-selling products per region and tied sales should share rank, use RANK() or DENSE_RANK(). If you need exactly one winner per group, use ROW_NUMBER().
SELECTregion,product_name,revenue,DENSE_RANK() OVER (PARTITION BY regionORDER BY revenue DESC) AS sales_rankFROM product_sales;Business rule before SQL rule
Most ranking bugs aren't syntax bugs. They're business-definition bugs.
Ask these questions first:
- What counts as a duplicate
Is it same user and event type, or same user, event type, and minute? - Which row should survive
Earliest, latest, highest quality, or successful status only? - How should ties behave
Shared rank, dense rank, or force a unique winner?
If you can't explain the tie-break rule in one sentence, don't write the query yet.
That discipline matters even more for AI data preparation. If you're building ordered user histories for model training, a bad deduplication rule changes the sequence itself, not just the report.
Practical Example 2 Time-Series Analysis and Moving Averages
Time-series analysis is where window functions start to feel less like a convenience and more like a core design tool. You can compare today with yesterday, this month with last month, or the current trend with a recent rolling baseline without writing self-joins that bury the business logic.
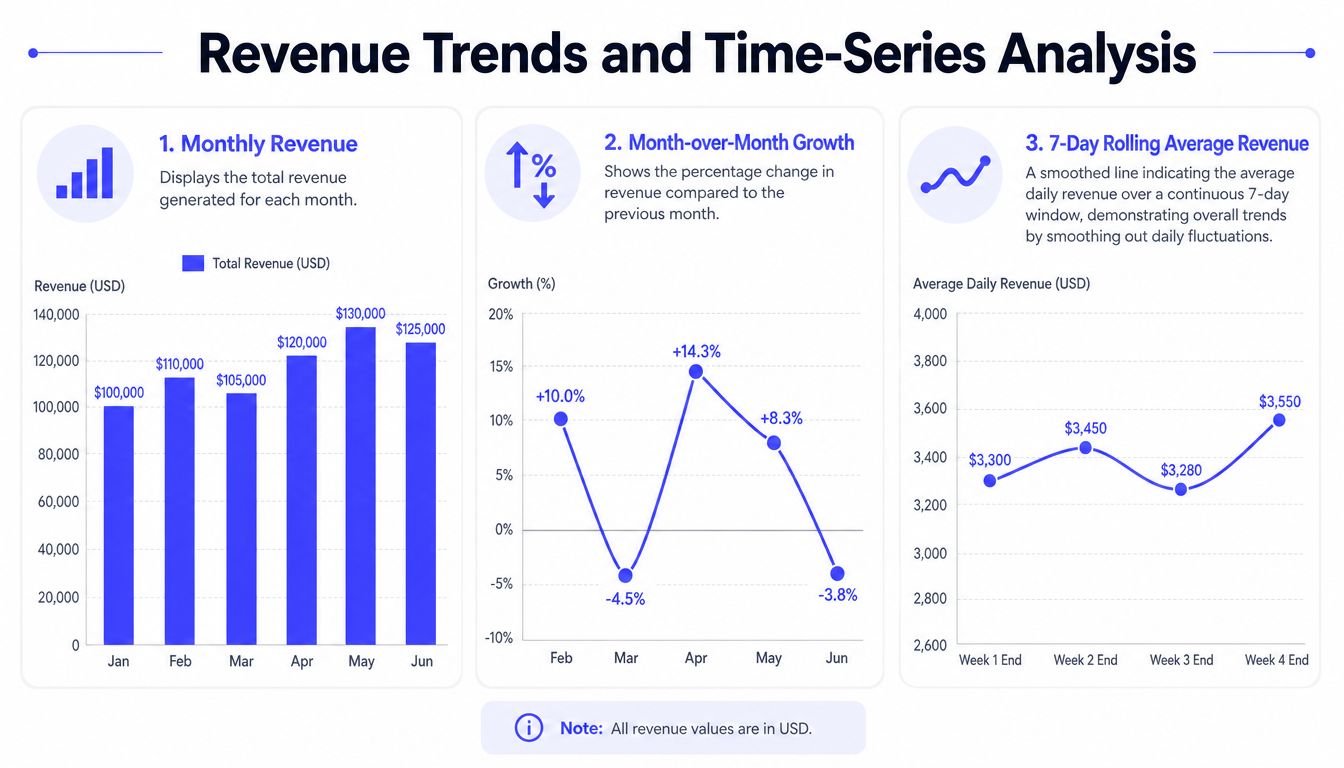
Mini case building a revenue trend view
Start with monthly revenue totals. Once each month is represented as one row, LAG() gives you the prior month in the same ordered series.
WITH monthly_revenue AS (SELECTmonth_start,revenueFROM finance_monthly_revenue)SELECTmonth_start,revenue,LAG(revenue) OVER (ORDER BY month_start) AS prev_revenue,revenue - LAG(revenue) OVER (ORDER BY month_start) AS revenue_changeFROM monthly_revenueORDER BY month_start;That pattern is common enough that the verified data notes LAG() and LEAD() are employed in 72% of month-over-month change and event-interval calculations.
For BI teams building executive dashboards, this is one of the cleanest ways to expose trend changes without pushing the logic into application code. If your reporting stack needs broader architecture help, I like reviewing examples from expert BI solutions from F1Group because they show how data modeling and dashboard design often need to move together.
Rolling windows smooth noisy behavior
Daily sales usually bounce around. Promotions, weekends, billing cycles, and delayed postings all create noise. A rolling calculation helps you see the trend under the noise.
SELECTorder_date,daily_sales,AVG(daily_sales) OVER (ORDER BY order_dateROWS BETWEEN 6 PRECEDING AND CURRENT ROW) AS rolling_avg_7dFROM daily_sales_summaryORDER BY order_date;The frame is doing the heavy lifting here. For each date, SQL looks at that row plus the previous six rows. If your data has one row per day, that becomes a 7-day rolling average.
The verified data also says SUM() OVER and AVG() OVER are used in 68% of running total and moving average implementations. That matches what most analytics engineers see in practice.
A moving average doesn't just make charts prettier. It helps a team distinguish signal from operational noise.
Where this matters for AI and ML preparation
This is the part most generic tutorials skip.
Suppose you're preparing user activity sequences for LLM fine-tuning, recommendation features, or churn prediction. You often need records like:
- prior action for each user
- time since previous event
- rolling count of actions
- running spend before the current interaction
- latest status before a support ticket opened
All of those are window patterns.
A simple event-gap feature looks like this:
SELECTuser_id,event_time,event_type,LAG(event_time) OVER (PARTITION BY user_idORDER BY event_time) AS prev_event_timeFROM user_events;From there, your downstream pipeline can derive elapsed intervals or session boundaries. If your team is also working on anomaly detection over ordered events, this pairs naturally with a broader time series anomaly detection workflow.
That bridge between BI and ML is why window functions matter so much. The same syntax that powers a finance dashboard also helps build sequence-aware training data.
Deep Dive Performance Pitfalls and Dialect Differences
Window functions can simplify ugly SQL. They can also become expensive if you ignore sort cost, partition size, and engine-specific behavior.
The good news is that they're often faster than self-joins for the same analytic task. The verified data states that window functions reduce query execution time by 40 to 60% compared to equivalent self-join or subquery approaches, particularly when indexing supports partition and order columns. But that doesn't mean every window query is efficient by default.
Where performance goes wrong
The most common issue is a bad partition or sort strategy.
If you partition a massive table on a column with poor selectivity, SQL may need to hold and sort far more rows than you expected. If you order on a column without useful index support, the engine has to work harder before the window calculation even begins.
Common pitfalls include:
- Oversized partitions
Partitioning by a broad key, or not partitioning when you should, can create huge working sets. - Unnecessary ordering
Some functions don't need a sort with the same intensity as ranking or running totals. AddingORDER BYcasually can raise cost. - Wrong tool for the job
If you only need one total per group,GROUP BYis often simpler and cheaper. - Hidden semantic bugs
LAST_VALUE()and frame defaults can surprise people because the effective frame may not be the entire partition unless you specify it.
The syntax is concise. The execution plan isn't.
A concrete SQL Server benchmark from Brent Ozar's windowing functions performance training shows complex queries executing in approximately 94 milliseconds with only 26 logical reads. The same verified data also notes that using the WINDOW clause in SQL Server requires database compatibility level 160 or higher, which is an easy environment detail to miss during migration planning.
Dialect differences you'll actually notice
Window functions are broadly available, but the syntax edges still vary. That matters when teams move between PostgreSQL, MySQL 8+, SQL Server, Oracle, or warehouse engines.
Here's a compact comparison focused on NTH_VALUE, which tends to reveal frame behavior and syntax expectations clearly.
| Database | NTH_VALUE Syntax | Notes |
|---|---|---|
| PostgreSQL | NTH_VALUE(expr, n) OVER (PARTITION BY ... ORDER BY ... ROWS BETWEEN UNBOUNDED PRECEDING AND UNBOUNDED FOLLOWING) | Usually clearer when you specify the full frame explicitly |
| MySQL 8+ | NTH_VALUE(expr, n) OVER (PARTITION BY ... ORDER BY ...) | Check frame support and default behavior carefully in your version |
| SQL Server | NTH_VALUE(expr, n) OVER (PARTITION BY ... ORDER BY ... ROWS BETWEEN UNBOUNDED PRECEDING AND UNBOUNDED FOLLOWING) | Watch compatibility settings for newer window syntax features |
| Oracle | NTH_VALUE(expr, n) OVER (PARTITION BY ... ORDER BY ... [frame]) | Strong support, but frame semantics still need review |
If your team is evaluating engine behavior more broadly, this is often part of the same discussion as Oracle vs PostgreSQL trade-offs, especially when analytics features and migration effort both matter.
AI pipelines change how you think about windows
Traditional BI usually asks, “What's the trend?” AI preparation often asks, “What was the ordered context before this event?”
That difference changes query design.
For model-ready sequence data, window functions help you create:
- Ordered histories per entity
One user, one account, one device, one document. - Relative features
Previous event type, previous spend, previous status, next action. - Rolling context
Recent counts, recent averages, recent anomaly flags. - Segment resets
Session starts, phase changes, or support-state transitions.
The verified data includes a useful industry note here: there's an underserved gap in explaining how classical SQL window logic connects to AI-driven data pipelines, particularly for temporal ordering and rolling statistics in training datasets. That gap is real. Many users still learn windows through reporting examples, then discover later that the same tools are central to feature engineering.
A short rule set for production use
- Index the partition and order columns when practical
That often matters more than micro-optimizing the select list. - Inspect the plan
Sorts and spills tell you where the cost really sits. - Specify frames deliberately
Don't rely on defaults for business-critical metrics. - Keep the business grain explicit
Window functions are precise. Your source table often isn't.
Checklist Choosing the Right Window Function
A lot of confusion disappears once you group window functions by job. The verified data says the SQL standard defines exactly three standard types of window functions: aggregate, ranking, and value, as summarized by Devart's SQL window functions guide.
Use this as a working checklist when you're choosing one.
Start with the business question
- You need to number rows uniquely inside a group
UseROW_NUMBER(). This is the clean choice for deduplication and “pick one row per entity.” - You need rank positions and ties matter
UseRANK()if gaps after ties are correct. UseDENSE_RANK()if they aren't. - You need to compare the current row with the previous or next row
UseLAG()orLEAD(). Good for change detection, interval analysis, and sequence features. - You need a running or rolling total
UseSUM() OVER(...)withORDER BY, and add a frame if the period must be bounded. - You need a moving average
UseAVG() OVER(...)with an explicit row or range frame. - You need the first, last, or nth value in an ordered group
UseFIRST_VALUE(),LAST_VALUE(), orNTH_VALUE(), but specify the frame carefully.
Match the function category to the task
| Category | Use when you need | Typical functions |
|---|---|---|
| Aggregate | cumulative or rolling metrics | SUM, AVG, COUNT over OVER() |
| Ranking | ordering and top-N logic | ROW_NUMBER, RANK, DENSE_RANK, NTILE |
| Value | previous, next, first, last, nth row context | LAG, LEAD, FIRST_VALUE, LAST_VALUE, NTH_VALUE |
Team checklist you can use today
“Before writing the SQL, name the row grain, the grouping key, the sort order, and the tie-break rule.”
Use this quick review before a query hits production:
- Grain check
What does one row represent before the window runs? - Partition check
Which rows belong in the same comparison set? - Order check
What sequence makes the result deterministic? - Frame check
Do you want cumulative, sliding, or full-partition behavior? - Output check
Are you preserving row detail on purpose, or wouldGROUP BYbe simpler?
What to Do Next
The easiest way to get real value from window functions isn't to memorize every function in the standard. It's to pick one painful query in your stack and refactor it.
Start with a report or pipeline step that currently uses a self-join for ranking, prior-row lookup, or cumulative metrics. Those are usually the fastest wins. You'll often end up with SQL that's easier to read, easier to test, and easier to explain to the next engineer.
Then widen the lens.
If you lead a data or AI team, look for places where row order matters but your current pipeline hides that logic in Python notebooks or BI tool formulas. Those are strong candidates for warehouse-side window functions. It gives you one canonical implementation for analytics, feature engineering, and model input preparation.
A practical next-step sequence looks like this:
- Share this guide with your analytics and data engineering team so everyone uses the same mental model for partitions, order, and frames.
- Refactor one production query that currently feels too complex for what it does.
- Audit one AI or ML preprocessing job to see whether sequence features belong in SQL earlier in the pipeline.
The payoff isn't academic. Better window-function usage means fewer brittle queries, clearer business logic, and faster delivery across BI and AI work.
If you need senior engineers who can build these patterns into production data and AI systems, ThirstySprout can help you hire vetted remote specialists in data engineering, MLOps, and LLM infrastructure. You can Start a Pilot, See Sample Profiles, or book a short scope call to map the work.
Hire from the Top 1% Talent Network
Ready to accelerate your hiring or scale your company with our top-tier technical talent? Let's chat.