
TL;DR
- For predictable data (e.g., daily active users with weekly cycles), start with simple statistical methods like Seasonal Hybrid ESD. They are fast, interpretable, and cheap to run.
- For complex, multivariate data (e.g., fraud signals), use unsupervised ML models like Isolation Forest. They don't require pre-labeled data and find non-obvious patterns.
- Production is key. A model is useless without a solid MLOps foundation for monitoring, automated retraining to fight concept drift, and a human-in-the-loop feedback system.
- Recommended Action: Start a 2–4 week pilot with an unsupervised model to create a performance baseline. Focus on building a feedback loop to label your first 100 anomalies.
Who this guide is for
- CTO / Head of Engineering: Deciding on the architecture and team needed to monitor critical systems (e.g., fraud, infrastructure, user engagement).
- Founder / Product Lead: Scoping the budget, timeline, and business impact for an anomaly detection feature.
- ML & MLOps Engineers: Building and deploying a reliable time series anomaly detection system.
Quick Framework: Your Anomaly Detection Decision Tree
Every good anomaly detection project begins with a simple question: What's the business impact? You have to define the cost of missing a critical event versus the pain of dealing with too many false alarms.
Think about it: a small dip in user engagement might just need a low-priority notification, but a potential fraud event demands someone's immediate attention. This business-first thinking keeps you from over-engineering a solution and ensures your technical choices deliver value. A typical pilot project to get your first model running takes about 2–4 weeks, focused on establishing a solid baseline for precision and recall.
This flowchart guides you to the simplest, most effective starting point based on your data's complexity and your operational needs.
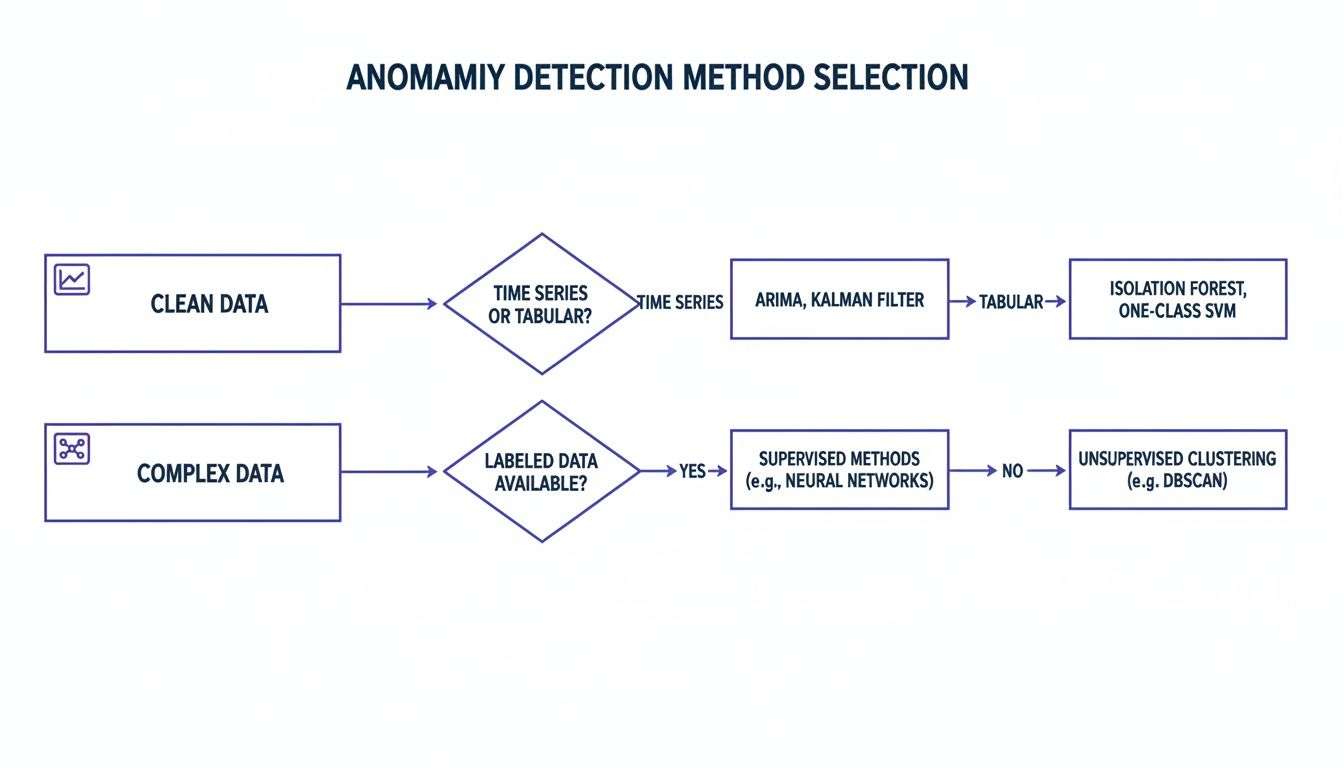
This diagram shows how to select an anomaly detection method. Start with statistical methods for predictable data and move to machine learning or deep learning for more complex, high-velocity streams.
The core idea is to match model complexity to data complexity. Always start with the simplest effective solution before jumping into resource-heavy approaches.
Practical Examples of Anomaly Detection
Theory is great, but seeing how these concepts protect revenue and keep customers happy is what matters. Here are two real-world scenarios you can adapt for your own monitoring, fraud, and reliability challenges.
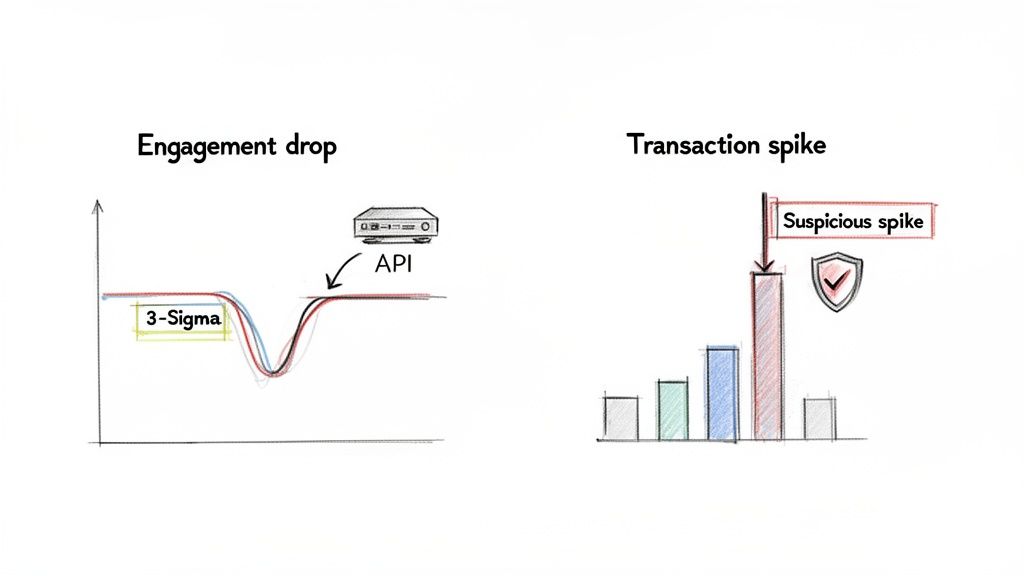
These graphs illustrate two common anomalies: a sudden drop in user engagement (left) and a sharp spike in transaction velocity (right), both critical signals for business operations.
Example 1: Keeping a SaaS Product Online by Watching User Engagement
Sudden drops in activity can be the first sign of a serious problem, like a bad deployment or a critical third-party service outage. Spotting these dips instantly is key to maintaining trust.
- Business Problem: Proactively catch significant drops in Daily Active Users (DAU) to identify service issues before customers notice.
- Method: Seasonal Hybrid ESD (Extreme Studentized Deviate). This statistical approach is perfect because DAU metrics have strong daily and weekly patterns. It's simple, efficient, and easy to explain.
- Implementation: The system ingests DAU counts hourly. The model learns the normal range for any given hour and day. If the DAU count drops more than three standard deviations (a 3-sigma event) below the expected baseline and stays there, an alert fires to a PagerDuty rotation.
- Business Impact: The ops team caught a faulty API deployment in under 30 minutes. The alert was traced to a spike in 5xx server errors, allowing an immediate rollback. This quick action prevented a major outage, a flood of support tickets, and protected revenue.
Example 2: Spotting Fraud in Fintech Transactions with a Code Snippet
For any fintech company, real-time fraud detection is a core business requirement. A classic red flag is an account that suddenly starts making an unusually high number of transactions.
- Business Problem: Flag individual user accounts showing suspicious spikes in transaction velocity, which could signal an account takeover.
- Method: Isolation Forest. This unsupervised machine learning model is a powerhouse for this use case. It doesn't need a pre-labeled dataset of "fraud" vs. "not fraud" and is highly efficient at finding rare events.
- Implementation: Instead of using raw transaction counts, we engineer features like
transactions_per_minuteandaverage_transaction_value_last_5_minutes. When the model flags an account, it automatically creates a high-priority ticket with user ID, recent transaction history, and the anomaly score.
A Python snippet to flag these outliers might look like this:
from sklearn.ensemble import IsolationForestimport pandas as pd# Sample data: user_id, timestamp, transactions_per_minute# ... feature_df = create_features(raw_transactions)# Initialize and train the model. Assume 0.1% of transactions are anomalies.model = IsolationForest(contamination=0.001, random_state=42)model.fit(feature_df[['transactions_per_minute']])# Predict anomalies (-1 for anomalies, 1 for normal)feature_df['anomaly_score'] = model.predict(feature_df[['transactions_per_minute']])# Filter for suspicious accounts to be sent for reviewsuspicious_accounts = feature_df[feature_df['anomaly_score'] == -1]print(suspicious_accounts)This code shows how to use scikit-learn's IsolationForest to identify outliers in transaction data based on the transactions_per_minute feature.
Deep Dive: Choosing the Right Anomaly Detection Method
Picking the right algorithm for time series anomaly detection isn't about chasing trends. It’s about finding a tool that fits your data and business goals. Let's break down the three main families of techniques.
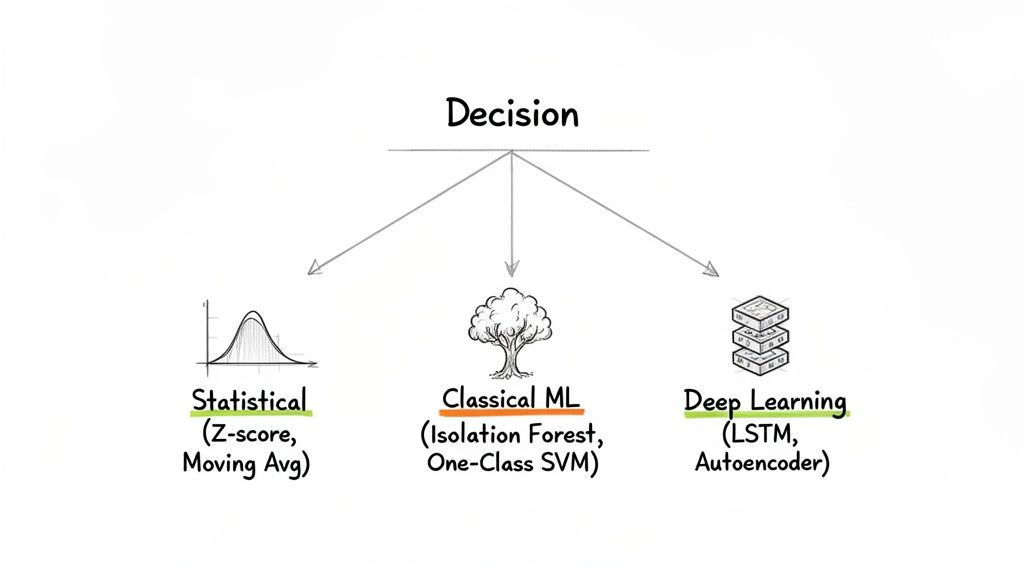
This diagram categorizes time series anomaly detection methods into Statistical (e.g., Moving Average), Classical ML (e.g., Isolation Forest), and Deep Learning (e.g., LSTM), showing a progression in complexity.
Statistical Methods: The Interpretable Baseline
These methods are your reliable first line of defense. They’re fast, simple, and easy to explain, making them perfect for data streams where "normal" is stable and predictable (e.g., server CPU usage, hourly sales).
- Moving Averages: Smooths out noise to reveal the underlying trend.
- Z-score / Standard Deviation: Assumes a normal distribution and flags points that fall, for example, more than three standard deviations from the average.
- Seasonal Hybrid ESD (Extreme Studentized Deviate): A robust statistical test that automatically accounts for seasonality, making it reliable for cyclical data.
When to use them: When you need a solution that's easy for stakeholders to understand, quick to deploy, and your data follows predictable patterns.
Classical Machine Learning: The Versatile Workhorse
When data doesn't follow a neat statistical pattern, classical Machine Learning (ML) models offer more flexibility. They handle complex, multi-dimensional data without making strict assumptions about its distribution. For a robust approach, exploring AI demand forecasting insights can reveal unusual patterns, helping you zero in on the best detection method for your needs.
- Isolation Forest: Works by randomly slicing data. Anomalies are few and different, so they are easier to "isolate." It’s efficient and scales well.
- One-Class SVM (Support Vector Machine): Draws a boundary around "normal" data points. Anything outside this boundary is an anomaly.
Deep Learning: The Advanced Specialist
For massive, high-speed datasets with subtle, complex patterns, you need specialists: deep learning models. They excel where traditional methods fail, especially at spotting long-term dependencies. However, they demand more data, compute power, and expertise.
- LSTMs (Long Short-Term Memory): A type of Recurrent Neural Network (RNN) with a "memory" that learns patterns over long sequences. It predicts the next data point; if the actual value is far from the prediction, it's an anomaly.
- Autoencoders: Learns to compress normal data to its essential features and then reconstruct it. When it can't reconstruct an input accurately, it's a strong signal of an anomaly.
Anomaly Detection Method Comparison
Here's a quick summary of the key trade-offs to help you decide.
From Notebook to Production: An MLOps Checklist
Getting a model out of a notebook and into production is where the real work begins. It’s less about algorithms and more about building a reliable system that handles live, messy data. The biggest challenge is concept drift: the definition of "normal" constantly shifts as user behavior and market conditions change.
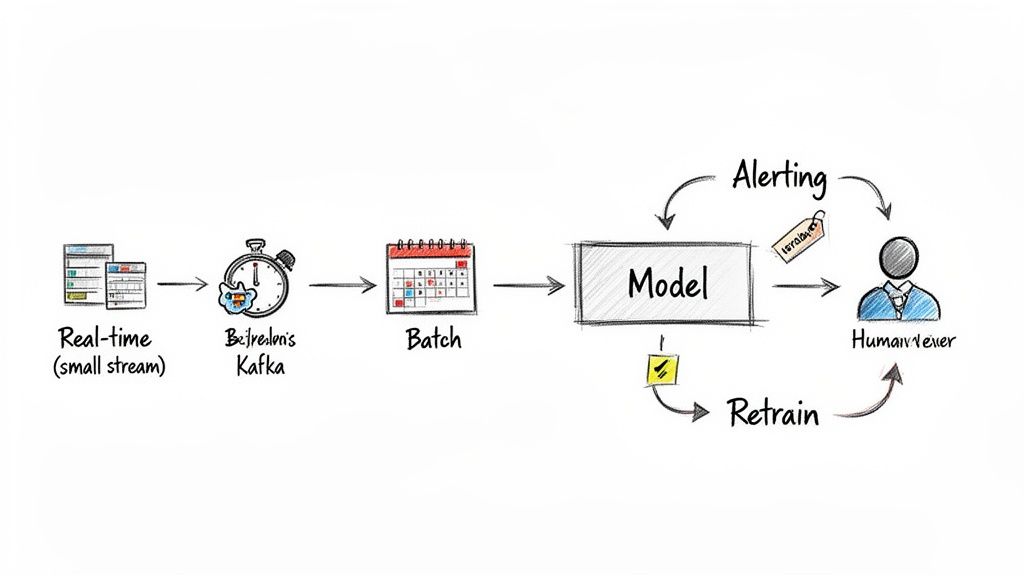
This workflow shows a production-ready anomaly detection system, from real-time data ingestion with Kafka to model serving, alerting, and a human-in-the-loop feedback mechanism for retraining.
Use this checklist to ensure your system is built to last.
- [ ] Define the business problem and KPIs. (e.g., "Reduce customer churn by detecting API degradation within 15 minutes.")
- [ ] Calculate the cost of failure. Decide whether to prioritize precision (fewer false alarms) or recall (catch more real problems).
- [ ] Validate data sources. Check for completeness, update frequency, and gaps.
- [ ] Engineer features. Craft signals that capture the behavior you care about (e.g.,
events_per_minute). - [ ] Establish a simple baseline. Start with a model like Seasonal ESD or Isolation Forest and document its performance. A baseline is the benchmark all future models must beat.
- [ ] Build an alerting and feedback loop. Define alert triggers and provide a simple UI for analysts to label alerts as "true anomaly" or "false alarm."
- [ ] Set up monitoring. Track model drift, precision, recall, and system health (latency, errors). Understanding the role of ML and AI in DevOps transformation is crucial here.
- [ ] Automate retraining and versioning. Build a pipeline to retrain the model on fresh data and version models for safe rollbacks. Building these systems often starts with the right foundation; you can explore some of the best data pipeline tools to get started.
What to do next
- Scope a 2-week pilot. Identify a critical time series metric and select a simple baseline model (like Isolation Forest) to run against historical data.
- Generate candidate anomalies. Use the model's output to create a list of the top 100 most unusual events from the past 90 days.
- Review with domain experts. Sit down with the team that owns the data and have them label the candidates as "true positive" or "false positive." This creates your first labeled dataset.
Ready to build an AI team that can ship production-grade systems? ThirstySprout connects you with the top 1% of vetted, remote AI and MLOps engineers who have the expertise to move your projects from concept to reality.
References & Further Reading
- Isolation Forest Documentation: scikit-learn.org
- Related ThirstySprout Article: Data Visualization Best Practices
Hire from the Top 1% Talent Network
Ready to accelerate your hiring or scale your company with our top-tier technical talent? Let's chat.