
TL;DR: Key Takeaways
- Choose the right chart: Match the chart type (bar, line, scatter) to your goal (comparison, trend, relationship). An incorrect chart misleads stakeholders.
- Remove clutter: Maximize the data-ink ratio by eliminating chart junk like 3D effects, heavy gridlines, and decorative backgrounds. A clean chart is an honest chart.
- Use color with purpose: Employ colorblind-safe palettes to highlight, not decorate. Ensure high contrast and use redundant encoding (icons, labels) for accessibility.
- Tell a data story: Structure visualizations to show a problem, action, and business impact (e.g., "50% cost savings"). Guide the user's eye to the most important insight.
- Validate with users: Test your charts with your target audience (CTOs, founders). A visualization is only effective if it's understood correctly.
Who this is for
This guide is for technology leaders who need to make data-driven decisions quickly and accurately:
- CTOs / Heads of Engineering: Evaluating architecture performance, resource allocation, and team velocity.
- Founders / Product Leads: Scoping AI features, tracking business KPIs, and presenting results to investors.
- Talent Ops / Hiring Managers: Analyzing recruiting funnels, assessing talent pools, and reporting on hiring efficiency.
If you need to translate complex data into clear, actionable business intelligence for your team or stakeholders, these best practices are for you.
1. Choose the Right Chart Type for Your Data Structure
Selecting the appropriate visualization is the most critical first step. The right chart clarifies relationships and provides immediate insight; the wrong one obscures meaning or actively misleads your audience. This decision is foundational to all other data visualization best practices.
The principle is to match the chart type to the data's structure and the specific message you need to convey. Different charts are engineered for distinct tasks: comparisons, trends, correlations, distributions, and compositions.
Practical Example 1: Comparing AI Talent Pools
A CTO at a growing SaaS company needs to decide where to focus their next hiring push. They need to compare the availability of talent across different AI specializations.
- Business Question: Which AI skill set has the largest talent pool in our network?
- Correct Chart: A horizontal bar chart. It allows for quick, accurate comparison between discrete categories like Natural Language Processing (NLP), Computer Vision, and MLOps.
- Why it Works: The length of each bar provides an immediate visual representation of magnitude, making it easy to see that the NLP talent pool is the largest. For more detail on skills like NLP, you can explore what natural language processing entails.
Practical Example 2: Tracking Hiring Velocity Over Time
A Head of Talent wants to show the impact of a new sourcing strategy on hiring speed over the last four quarters.
- Business Question: Has our time-to-hire improved since we implemented the new strategy in Q2?
- Correct Chart: A line chart. It effectively illustrates the continuous progression of data points, highlighting momentum or slowdowns across a time series.
- Why it Works: The downward slope of the line after Q2 provides an undeniable visual story of improvement.
Checklist: How to Choose the Right Chart
- Define the Core Insight: Start with the single message for the viewer. Is it "MLOps talent is our fastest-growing pool" or "Our new algorithm reduced time-to-hire by 15%"?
- Comparing values between groups? → Bar Chart
- Showing a trend over time? → Line Chart
- Showing parts of a whole? → Stacked Bar Chart (avoid pie charts with >3 slices)
- Investigating a relationship between two variables? → Scatter Plot
- Validate for Distortion: Does the chart misrepresent the data? Avoid 3D effects or truncated axes that exaggerate differences. Stick to 2D for clarity.
- Before (High Chart Junk): A 3D bar chart with a gradient background, dark gridlines, and shadows on the bars. It's visually busy and difficult to read the precise values.
- After (High Data-Ink Ratio): A 2D horizontal bar chart. The background is white, gridlines are light gray or removed, and data labels are placed directly on the bars. The focus is entirely on the data: candidate sources and their conversion rates.
- Business Impact: The clean version allows the manager to identify the highest-performing recruiting channel in under three seconds, enabling faster resource allocation.
- Remove Backgrounds & Borders: Set the chart background to white or transparent. Remove any containing box or border.
- Mute or Remove Gridlines: If gridlines are necessary, make them a light gray. Often, they can be removed entirely in favor of direct data labels.
- Eliminate 3D & Shadows: These effects distort perception and add no informational value. Always use 2D representations.
- Conduct the "Squint Test": Squint at your visualization. The data itself (bars, lines, points) should be the most prominent element. If decorative features stand out, they are chart junk.
- Before (Inaccessible): Status is encoded using green for "On Track," yellow for "At Risk," and red for "Blocked." This is unreadable for anyone with red-green color blindness.
- "On Track" = Blue + Checkmark Icon (✔)
- "At Risk" = Orange + Warning Icon (⚠)
- "Blocked" = Red + Stop Icon (✖)
- Business Impact: All stakeholders, regardless of vision, can instantly understand project health. This prevents critical "Blocked" projects from being overlooked. This technique is called redundant encoding.
- Use Colorblind-Safe Palettes: Start with proven palettes like Okabe-Ito or Viridis. Use tools like ColorBrewer to select palettes appropriate for your data (categorical, sequential, or diverging).
- Check Contrast Ratios: Use a contrast checker to ensure text meets a minimum 4.5:1 ratio and graphical elements meet a 3:1 ratio against the background, per Web Content Accessibility Guidelines (WCAG) 2.1 AA standards.
- Implement Redundant Encoding: Don’t rely on color alone. Supplement your color scheme with other visual cues like patterns, icons, direct labels, or varying shapes.
- Misleading: The Q1 chart's Y-axis runs from 0 to 1,000 daily active users (DAU). The Q2 chart's Y-axis runs from 800 to 1,500 DAU. The Q2 growth looks visually massive because the axis is "zoomed in."
- Honest: Both charts use the same Y-axis scale of 0 to 1,500 DAU. This provides a true, proportional representation of growth between the two quarters.
- Business Impact: Honest scaling builds trust with stakeholders. Manipulated axes can destroy credibility and lead to poor strategic decisions based on exaggerated perceptions of success or failure.
- Start Bar Charts at Zero: For bar charts showing magnitude, always start the Y-axis at zero. Truncating the axis overstates differences. If a non-zero baseline is necessary (e.g., for stock price fluctuations), call it out clearly.
- Use Consistent Intervals: Ensure scaling is consistent across all related charts meant for comparison. If one chart shows hiring velocity on a scale of 0-60 days, a companion chart for a different team should use the same scale.
- Label Axes Clearly: Always label your axes, including units (e.g., "Days to Hire," "Cost Savings ($ thousands)," "Candidate Match Rate (%)"). This removes ambiguity.
- Inefficient: A pie chart with a color-coded legend on the side. The viewer has to look back and forth between the legend and the chart to understand which slice belongs to which company.
- Efficient: A horizontal bar chart with the company name and percentage labeled directly at the end of each bar. The information is self-contained and understood instantly.
- Business Impact: In a high-stakes presentation, direct labeling ensures your message lands without friction. Decision-makers can grasp the competitive landscape in seconds, not minutes.
- Prioritize Proximity: Place labels on or immediately next to the data they describe. For line charts, place the series name at the end of the line. For bar charts, place the value inside or just above the bar.
- Ensure Readability: Use a font color and size that contrasts clearly with the background. Ensure labels don't overlap, especially in dense charts.
- Use Legends as a Last Resort: If a chart is too crowded for direct labels (e.g., a scatter plot with many categories), a legend may be necessary. Position it where it doesn't obstruct the data.
- For the Engineering Team: A detailed dashboard with metrics like model latency, API error rates, and GPU utilization. This is complex, granular, and designed for operational monitoring.
- For the CEO/Board: A single slide with two large numbers: "+15% User Engagement" and "$250k Projected Annual Revenue Lift." This is high-level, focused on business impact, and immediately understandable.
- Business Impact: Tailoring the visualization ensures the right message is delivered to the right audience. Engineers get the data they need to optimize, while executives get the data they need to make strategic investments. Creating such user-centric tools is crucial; understanding the responsibilities in a UI/UX designer job description can highlight the expertise needed for these effective interfaces.
- Define Audience Personas: Create 2-3 profiles (e.g., "The Executive," "The Technical Lead," "The Operator"). List their primary goal, key questions, and technical comfort level.
- Match Complexity to Context: A dashboard for daily monitoring can be dense and interactive. A chart in an email or report must be simple, static, and stand on its own with clear annotations.
- Test with Real Users: Before finalizing, share a draft with a representative from the target audience. Ask them, "What is the key takeaway here?" If they can't answer in five seconds, your design needs refinement.
- Setup (The Problem): A line chart titled "Time to Hire is Increasing," showing a steady upward trend over the last six months. The line is colored red for emphasis.
- Conflict (The Solution): A simple text slide: "Proposed Solution: Implement ThirstySprout's AI Matching Platform."
- Resolution (The Impact): A final bar chart titled "Pilot Program Reduced Hiring Costs by 50%." The "After" bar is highlighted in a contrasting color (e.g., blue), and the "50% Savings" is in large, bold text.
- Business Impact: This narrative structure makes the data memorable and persuasive. It frames the solution not as a cost, but as a clear solution to a documented problem with a proven ROI.
- Write the Headline First: Before creating the chart, write the key takeaway as a single sentence. This becomes your chart's title.
- Use Visual Cues for Emphasis: Make the most important number the largest. Use a contrasting "action" color (like blue or green) to highlight the key data point. Use muted colors (like gray) for context or comparison data.
- Annotate for Clarity: Add brief text labels or callouts to explain "why" a data point is important. Don't make the audience guess what a spike in a line chart means.
- Misleading: A big number on a slide: "92% Success Rate." This lacks context. Was this based on 10 placements or 10,000?
- Credible: The same slide, but with context: "92% Success Rate (n=5,140 placements)." The large sample size demonstrates the metric's reliability. A bar chart showing this rate could also include error bars to represent the confidence interval, communicating the metric's precision.
- Business Impact: Statistical context is the foundation of trust. For CTOs and founders making budget decisions, knowing a metric is stable and reliable is non-negotiable. For those using advanced analytics, understanding how AI is transforming market analysis by exploring AI stock charts can provide further insight into trend validation at scale.
- Always Include Sample Size (n): For any summary statistic (average, percentage), label the chart with the sample size: "n = [number]".
- Show Variability with Error Bars: When showing averages, add error bars to represent the standard deviation or confidence interval. This visually communicates the data's precision.
- Be Clear About Significance: A finding might be statistically significant (unlikely due to chance) but not practically significant (large enough to matter to the business). Reviewing MLOps best practices can help identify which metrics have practical weight.
- Desktop View: A detailed dashboard with multiple charts, complex filters, and hover-over tooltips showing candidate details.
- Mobile View: The dashboard reconfigures to a single-column layout. It prioritizes 3-4 key metrics as large "cards" at the top (e.g., "Active Candidates," "Time-to-Fill," "Offer Acceptance Rate"). The detailed charts are available below, but the most critical information is visible without scrolling or interaction.
- Business Impact: The founder gets the critical information they need in seconds, from any device, allowing them to make informed decisions on the move.
- Design Mobile-First: Start by designing for the smallest screen. This forces you to prioritize the most critical information. Then, enhance the design for larger screens.
- Simplify and Prioritize: On smaller screens, remove non-essential elements. A simple, large number showing a KPI is often more valuable on mobile than a cluttered chart.
- Adapt Interactions: Replace desktop-centric interactions like hover tooltips with mobile-friendly alternatives like tap-to-reveal. Ensure touch targets are large enough for fingers.
- Exploration: Used by analysts and data scientists to dig into complex datasets. These tools are interactive, dense, and feature-rich, designed to answer unknown questions. Think of a complex Tableau or Looker dashboard with many filters.
- Explanation: Used by leaders to communicate a specific, known insight to an audience. These visuals are simple, static, and focused, designed to tell a clear story. Think of a single, powerful chart in a presentation.
- Exploration Phase: The data scientist uses an interactive dashboard with scatter plots, heatmaps, and dozens of filters (user tenure, subscription plan, feature usage) to find correlations. After hours of analysis, they discover a key insight: users who don't adopt "Feature X" within their first 7 days are 80% more likely to churn.
- Explanation Phase: When presenting to the product team, the data scientist doesn't show the complex exploratory dashboard. Instead, they present a single, clear bar chart titled: "Users Adopting Feature X in Week 1 Have 80% Higher Retention." It has two bars: "Adopted Feature X" and "Did Not Adopt."
- Business Impact: By separating the two phases, the team avoids overwhelming stakeholders with raw data. They deliver a clear, actionable insight that the product team can use to drive user onboarding improvements.
- Define the Goal First: Before building, ask: "Is this for finding new questions (exploration) or communicating a known answer (explanation)?"
- Build Two Versions if Needed: Use a complex tool for your internal analysis. Then, create a separate, simplified visual for your presentation. Don't show your messy "kitchen" to your dinner guests.
- Test the Explanation: The ultimate test of an explanatory visual is whether the audience gets the point without you having to explain it. Show it to a colleague and ask, "What is the key takeaway here?"
- Audit Your Key Dashboard: Pick one critical dashboard and evaluate it against this checklist. Identify three improvements you can make this week, focusing on removing chart junk and clarifying the primary message.
- Create a Simple Style Guide: Standardize your team's approach. Define your core color palettes (categorical, sequential, diverging), font sizes, and rules for axis labels. This creates consistency and speeds up development.
- Start a Pilot: Ready to build the team that turns data insights into production-ready AI features? ThirstySprout connects you with the top 2% of pre-vetted AI, ML, and data engineering talent, ready to start in as little as two weeks.
2. Prioritize Data-Ink Ratio and Remove Chart Junk
Coined by statistician Edward Tufte, the data-ink ratio is a core principle for clear visualizations. The idea is simple: dedicate the majority of a graphic’s “ink” to displaying data and ruthlessly eliminate non-data elements, or “chart junk.” This minimalist approach prevents cognitive overload and directs the viewer’s full attention to the insights.
This means removing distracting 3D effects, heavy gridlines, unnecessary labels, and decorative backgrounds. Every pixel should serve a purpose.
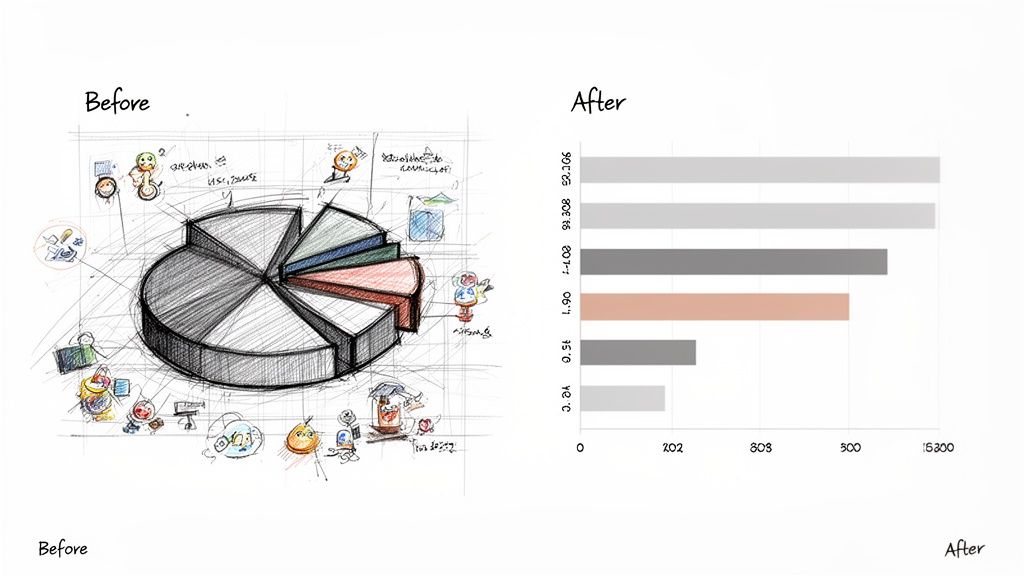 Alt Text: Before and after data visualization. The 'before' chart is a cluttered 3D bar chart with a dark background. The 'after' chart is a clean 2D bar chart with no background, maximizing the data-ink ratio.
Practical Example: Cleaning a Hiring Pipeline Dashboard
A hiring manager's dashboard shows key performance indicators (KPIs) for the recruiting funnel.
Checklist: How to Maximize Data-Ink
3. Use Color Strategically and Maintain Accessibility
Color should encode information and guide attention, not just decorate. With approximately 8% of men having some form of color blindness, accessibility is non-negotiable. An inaccessible chart fails its mission to communicate clearly to all stakeholders.
The principle is to select color palettes that are robust against common vision deficiencies and ensure sufficient contrast. For a global talent network like ThirstySprout, where dashboards are viewed by diverse clients, this practice is critical.
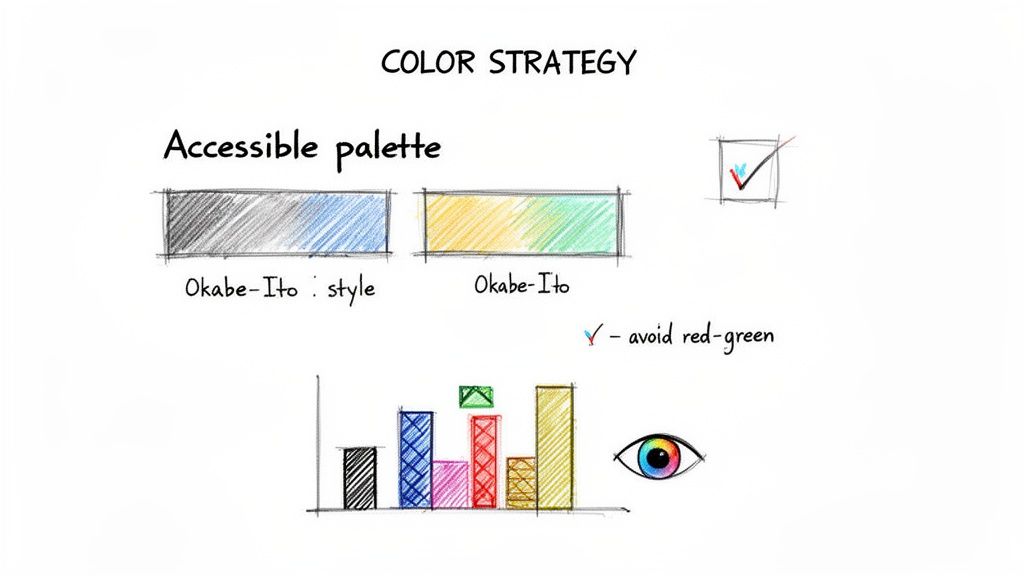 Alt Text: A diagram showing accessible color choices for data visualization. It highlights using colorblind-safe palettes and avoiding red/green combinations, with examples of good contrast.
Practical Example: Redesigning a Status Dashboard
A project manager uses a dashboard to track the status of different engineering projects: "On Track," "At Risk," and "Blocked."
Checklist: How to Use Color Accessibly
4. Maintain Consistent Scaling and Axis Alignment
Inconsistent scaling is a common way to distort data perception. Properly aligned axes are fundamental to ensuring an honest comparison, especially when presenting performance metrics to executives or investors. The core principle is to establish a consistent baseline that allows for fair comparison.
Practical Example: Reporting on Quarterly Performance
A product lead is presenting user engagement metrics from Q1 and Q2.
Checklist: How to Ensure Axis Integrity
5. Label Data Directly and Minimize Legends
Directly labeling data points, lines, or bars eliminates the mental effort of referencing a separate legend. By placing labels next to the elements they describe, you reduce cognitive load and speed up comprehension.
Practical Example: Visualizing Market Share
An analyst is showing market share distribution among four competitors.
Checklist: How to Use Direct Labeling
6. Design for Your Audience and Context of Use
A technically perfect visualization fails if it doesn’t resonate with its audience. Tailor the design, complexity, and message to who is viewing it and where. A dashboard for a CTO requires a different lens than a slide for a board presentation.
Practical Example: Reporting on a New AI Feature Launch
A team needs to report on the launch of a new AI-powered recommendation engine.
Checklist: How to Design for Your Audience
7. Tell a Data Story with Clear Visual Hierarchy
Effective visualizations guide the viewer through a narrative. A clear visual hierarchy—using size, color, and positioning—transforms disconnected data points into an actionable story. It directs attention to what matters most.
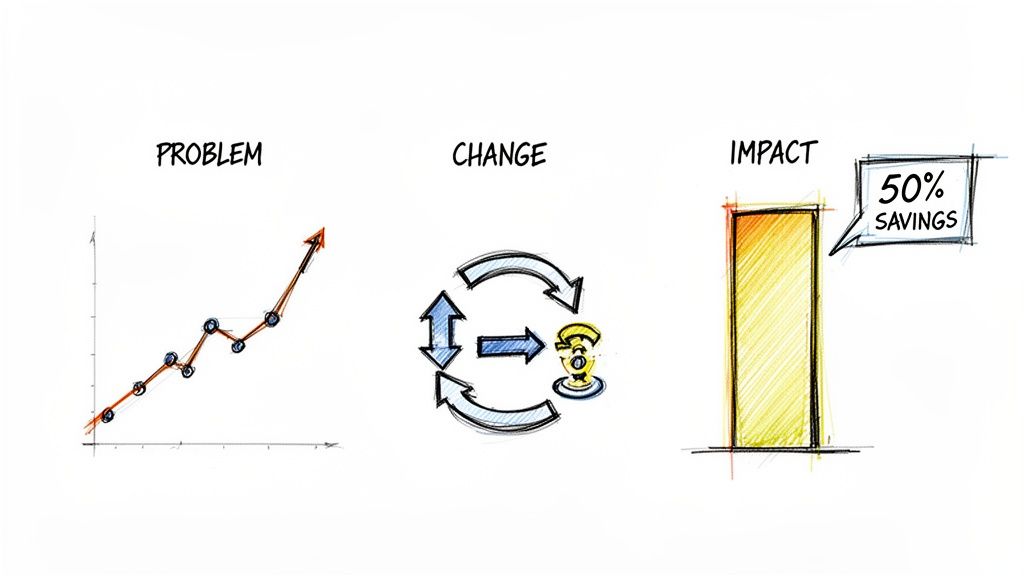 Alt Text: A three-part diagram showing data storytelling. Part 1 shows a rising problem on a graph. Part 2 shows a process change. Part 3 shows the positive result: a bar chart highlighting '50% Savings'.
Practical Example: Pitching a New Hiring Strategy
A Head of Talent needs to get buy-in from the CFO for a new data-driven hiring platform.
Checklist: How to Tell a Data Story
8. Use Appropriate Sample Size and Statistical Context
A compelling chart is misleading if it lacks statistical integrity. Presenting findings from small or unrepresentative samples as universal truths can lead to poor, high-stakes decisions. Providing context like sample size (n) and variability (error bars) builds trust and ensures decisions are based on robust evidence.
Practical Example: Reporting on Candidate Success Rates
A talent platform wants to claim a high success rate for its candidate matching algorithm.
Checklist: How to Provide Statistical Context
9. Optimize for Mobile and Responsive Design
With decisions increasingly made on the go, responsive design is a core requirement. Visualizations built only for desktop often fail on mobile, becoming unreadable and unusable. A responsive visualization adapts its layout, content, and interactivity to deliver clarity on any screen.
Practical Example: A Mobile Dashboard for a Founder
A founder is traveling and needs to check on the hiring pipeline before a meeting.
Checklist: How to Design Responsively
10. Distinguish Between Exploration vs. Explanation
Effective teams recognize that data visualization serves two distinct purposes: exploration (finding insights) and explanation (communicating insights). Confusing the two leads to ineffective communication.
Practical Example: Analyzing User Churn
A data team is tasked with understanding and reducing user churn.
Checklist: How to Match Purpose to Design
What to do next: Your Action Plan
Skip the lengthy hiring cycles and build the expert team you need to create impactful data visualizations and scalable AI solutions today. Book a 20-minute call to scope your pilot.
Hire from the Top 1% Talent Network
Ready to accelerate your hiring or scale your company with our top-tier technical talent? Let's chat.