

Quadratic regression models the relationship between variables as a second-degree polynomial, fitting a parabolic curve to data points. If your data bends instead of running in a straight line, this model can be the right next step.
Quadratic Regression Explained for AI Teams
Quadratic regression is the right tool when a straight line misses a visible bend in the data. It fits a curve that can rise, flatten, and turn, which makes it useful for patterns like diminishing returns, saturation, or a metric that improves and then levels off.
This matters most for CTOs, ML engineers, and product leads who need a model that is simple enough to ship but flexible enough to match reality. If you are deciding whether a forecasting feature should stay linear or become curved, quadratic regression is often the first model worth testing.
Quick signals that it may help
- Your residual plot curves instead of scattering randomly.
- Domain knowledge suggests a bend, such as returns tapering off after a threshold.
- You need a light model, not a complex stack with higher-order polynomials.
- You want something interpretable, because quadratic terms are easier to explain than a wavy higher-degree fit.
A useful way to think about it is this. Linear regression draws the best straight line through your data. Quadratic regression draws the best parabola through it, which helps when the relationship has one clear turn.
Practical rule: if a straight line leaves a U-shape in the residuals, test a quadratic fit before reaching for a more complex model.
The business value is simple. You can often capture the main curve in engagement, cost, or calibration data without adding much modeling overhead. That means faster iteration, lower implementation risk, and a cleaner story for stakeholders who need to understand why the forecast behaves the way it does.
The Math and Intuition Behind Quadratic Regression
A quadratic model uses the familiar form y = ax² + bx + c. The x² term is what creates the bend, the bx term tilts the curve, and c shifts it up or down.
A thrown ball is a good mental model. It rises, slows, peaks, and falls in a smooth arc. A straight line would miss that shape completely, while a quadratic curve can track the rise and the turn with much less distortion.
Why the curve matters
If your data bends, the model has to bend too. When you force a line onto curved data, the error tends to cluster in a pattern, which is a signal that the model is underfitting. Quadratic regression gives the model one extra degree of freedom, and that extra flexibility often lets it match the shape you observe.
The coefficients have plain meanings. a controls how strong the curvature is, b changes the tilt, and c sets the baseline. In practice, you rarely care about the raw coefficient values as much as the shape they produce.
The fitting process still follows the same basic idea as linear regression. The model tests different coefficient values, measures the error, and keeps adjusting until the curve gets as close as possible to the data overall. That “close as possible” step is what least squares is doing, it chooses the curve that keeps the total squared error small across the full dataset.
For a broader mental model of how sequence length and context affect model behavior in nearby ML systems, the practical LLM context window guide is a useful companion. It's not about regression, but it helps you think about how model limits shape outputs in production.

The model is not trying to “discover truth” in the abstract. It's trying to draw the curve that best explains the data you gave it.
Quadratic vs Linear and Polynomial Models
A quadratic model sits in the middle. It is more flexible than a line, but less volatile than a higher-degree polynomial that keeps bending to chase noise. That middle ground is why it shows up so often in real ML pipelines.
Choosing the right shape
Use a linear model when the relationship is close to straight and the residuals look random. Use quadratic regression when the line leaves a visible curve and the domain suggests one main bend. Use a higher-degree polynomial only when you have strong reason to believe the signal changes direction multiple times.
The trade-off is not just statistical, it's operational. More flexible models can be harder to explain, harder to debug, and more fragile when you move from training data to real traffic. In production, that fragility can matter more than a small gain in fit quality.
| Model | Flexibility | Overfit risk | Compute cost | Best fit for |
|---|---|---|---|---|
| Linear | Low | Low | Low | Mostly straight relationships |
| Quadratic | Medium | Moderate | Moderate | One clean bend |
| Higher-degree polynomial | High | High | Higher | Multiple turns, with strong evidence |
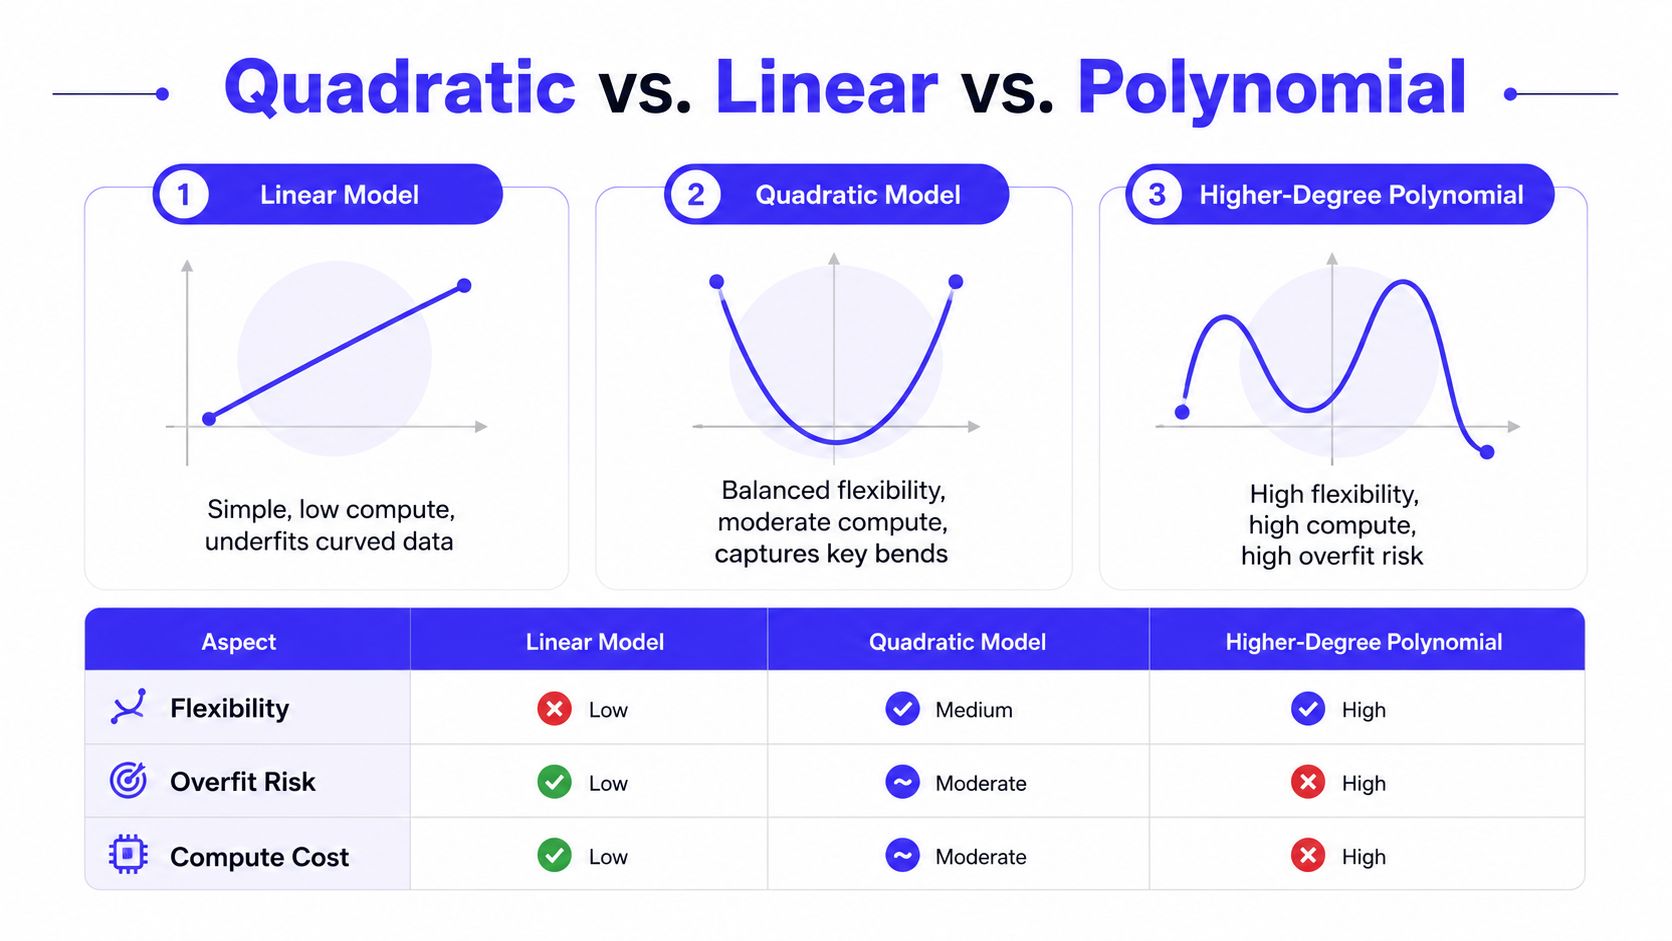
If you are deciding between them, start with the residual plot. A U-shaped residual pattern often means the line is too simple. From there, quadratic is usually the safest next step before you escalate to something more complex.
Python and Excel Code Examples
A small synthetic dataset makes the idea easy to test. Suppose you track engagement and notice that it rises at first, then starts to flatten. A quadratic fit can capture that shape in a few lines of code.
Python example with NumPy
import numpy as np# Synthetic engagement datax = np.array([1, 2, 3, 4, 5, 6])y = np.array([2, 5, 8, 10, 11, 11])# Fit a quadratic curvecoeffs = np.polyfit(x, y, deg=2)a, b, c = coeffsprint("a:", a)print("b:", b)print("c:", c)# Predict values from the fitted curvemodel = np.poly1d(coeffs)predicted = model(x)print("Predicted values:", predicted)If a is negative, the curve bends downward. If a is positive, it bends upward. The sign helps you read the broad shape, but you still need to compare the fitted line against the points before you trust it.
The important habit is not just running the fit. It's checking whether the curve matches the story your product data is already telling you. For more on working with arrays before you fit a model, the internal guide on NumPy array operations is a useful reference.
Excel example with a trendline
- Put your x values in one column and your y values in the next.
- Highlight both columns and insert a scatter plot.
- Click the data series, then add a trendline.
- Choose Polynomial and set the order to 2.
- Turn on Display Equation on chart so you can inspect the curve.
- Compare the plotted curve with the points and ask whether the bend matches the pattern you expected.
You can do this with a simple engagement or conversion dataset in minutes. Excel won't teach you the math, but it will show you whether a quadratic curve is visually better than a straight line.
A simple workflow helps teams move quickly:
- Plot first: Look for curvature before fitting anything.
- Fit second: Try degree 1, then degree 2.
- Inspect third: Check whether the curve improves the shape without becoming hard to justify.
- Decide last: Keep the quadratic only if it makes the pattern clearer and the error structure cleaner.
Real World Use Cases for ML Engineers
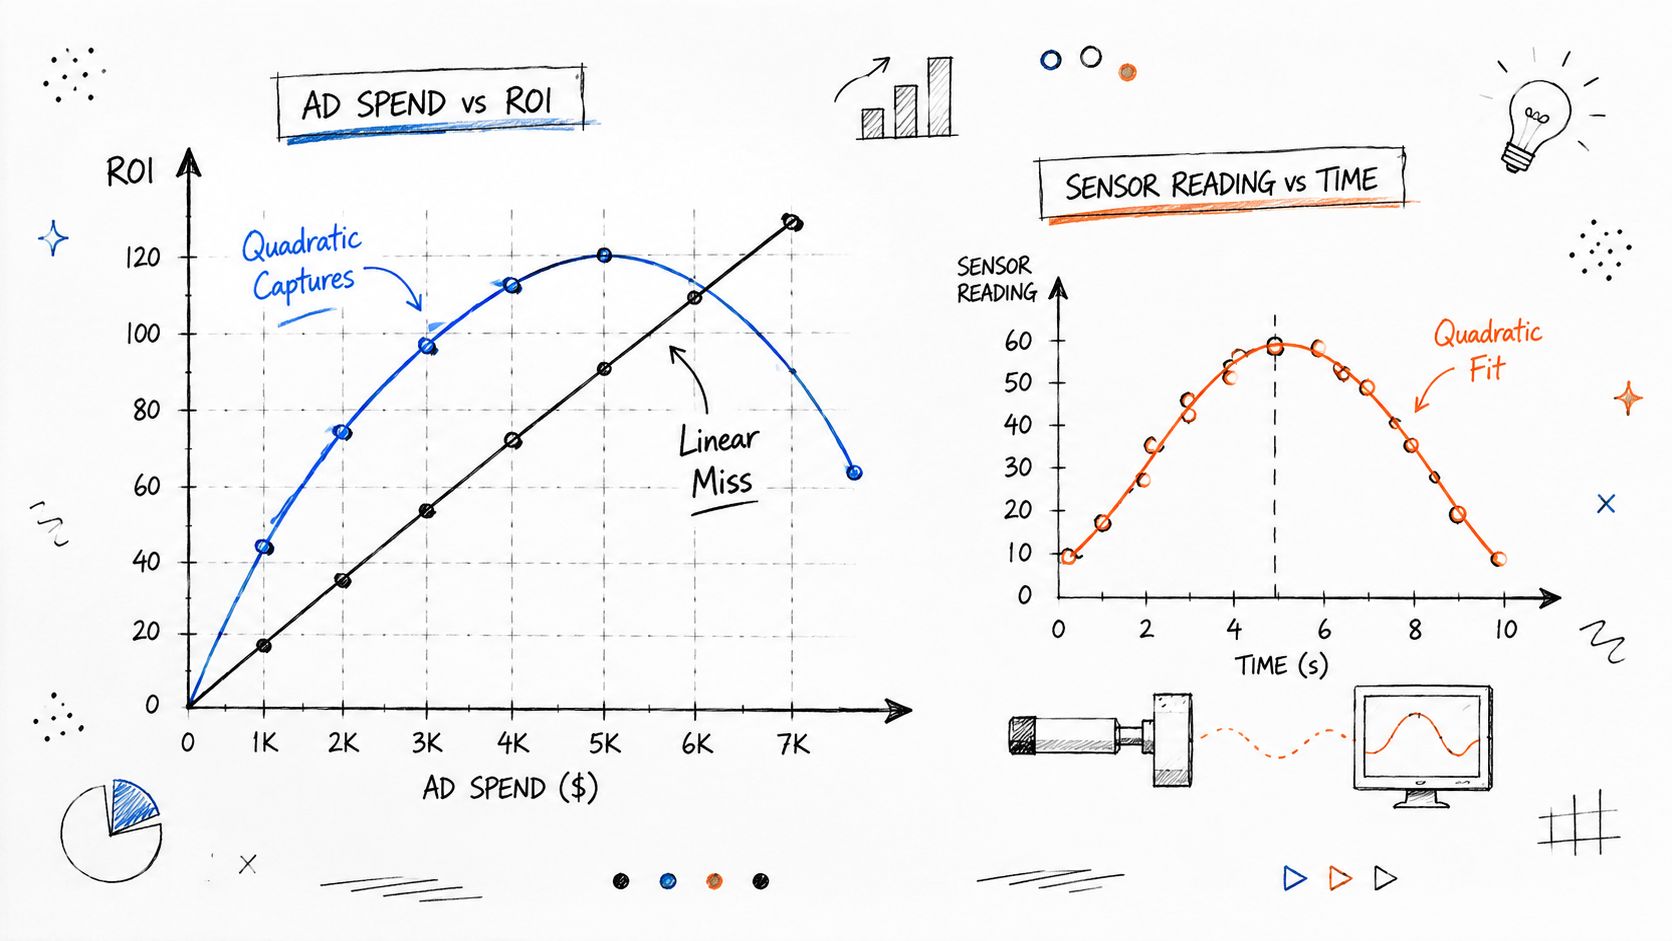
A fintech team once had a common problem, paid acquisition looked strong at low spend, then stopped improving as spend increased. A linear model kept implying steady gains, which pushed the team toward wasteful budget allocation. A quadratic fit matched the bend more accurately, so the team could see where additional spend stopped paying off.
A second team used the same idea for sensor calibration. Their hardware output drifted in a curved way, and the calibration step had to correct that bend before the feature reached downstream models. A quadratic relationship was enough to model the drift cleanly without introducing a more complicated curve that would have been harder to maintain.
What these cases have in common
Both teams needed the same thing, a model that could capture one meaningful bend without turning the pipeline into a science project. In both cases, the model served the product, not the other way around.
For a broader view of adjacent analytic methods, the internal note on data analysis techniques is a helpful companion.
The best use of quadratic regression is often not “better prediction everywhere.” It's clearer decision-making where the data actually bends.
A practical rollout for an ML team usually looks like a short pilot. One person checks the plot, one person fits the model, and one person reviews whether the curve changes a decision that matters. If it doesn't change a decision, the model is probably not worth keeping.
The Scrapfly overview on read about Scrapfly's AI tools is also useful if you are building pipelines that start with messy external data and need a clean numerical relationship before modeling.
Diagnostics and Common Pitfalls
A quadratic fit can look elegant and still be wrong. The most useful check is the residual plot, because it tells you whether the model left structure behind. If the residuals still show curvature, the fit is incomplete.
What to look for
A clean fit leaves residuals scattered without a visible pattern. A bad fit leaves a curve, a fan shape, or clusters that suggest the model is missing something systematic. That's where teams often confuse “good-looking line” with “good model.”
Common failure modes
- You fit curvature to noise. The curve looks clever, but it follows random wiggles.
- You trust extrapolation too far. Quadratic models can behave oddly outside the data range.
- You overread fit quality. A single metric can look fine while the curve still misleads you.
- You skip domain knowledge. If the process is known to be linear, forcing a bend is just adding risk.
A high score can hide practical problems. A model can fit the training data reasonably well and still behave badly on new inputs, especially near the edges of the observed range. That's why you should treat the shape of the curve as a product decision, not just a math outcome.
If the business process has no reason to bend, a quadratic curve is usually a distraction, not an improvement.
A useful check is to ask whether the bend makes sense in the system. For example, a saturation curve in usage data is plausible, but a wild turn in a stable operational metric may be a warning sign. If the curve only looks better because the dataset is small, you may be fitting too much structure to too little evidence.
The internal overview on principal component analysis definition is a good reminder that simpler representations often win when data is noisy or sparse. Different method, same lesson, complexity has to earn its keep.
Summary and Next Steps for Your Team
Quadratic regression is the right middle step when linear regression is too simple and a more complex polynomial is more than you need. It fits a single bend in the data, keeps the model interpretable, and often gives product teams a practical improvement without much extra operational cost.
A simple decision framework works well:
- Plot the data. Look for a bend, not just a trend.
- Fit a linear model first. Use it as the baseline.
- Check the residuals. A curved pattern is your cue to test quadratic.
- Compare the result to domain knowledge. If the bend makes no sense, stop.
- Keep the simplest model that explains the shape. That is usually the one easiest to ship and maintain.
If your team wants something reusable, a short checklist in PDF or CSV form is the fastest handoff. It can cover plot inspection, residual checks, domain assumptions, and the decision to stay linear or move to a quadratic fit.
For teams working on forecasting, calibration, or engagement models, the next move is straightforward. Assess curvature in your current data, run a quick pilot, and decide whether a quadratic model improves the decision your product needs to make. If it does, bring in senior ML talent to help harden the approach and move it into production with less friction.
ThirstySprout helps teams hire vetted remote ML engineers who can evaluate curve fitting choices, build forecasting pilots, and turn a quadratic idea into a production-ready workflow. If you need help scoping the right model for your data, visit ThirstySprout and start a pilot with specialists who can move quickly and work in your stack.
Hire from the Top 1% Talent Network
Ready to accelerate your hiring or scale your company with our top-tier technical talent? Let's chat.