
TL;DR
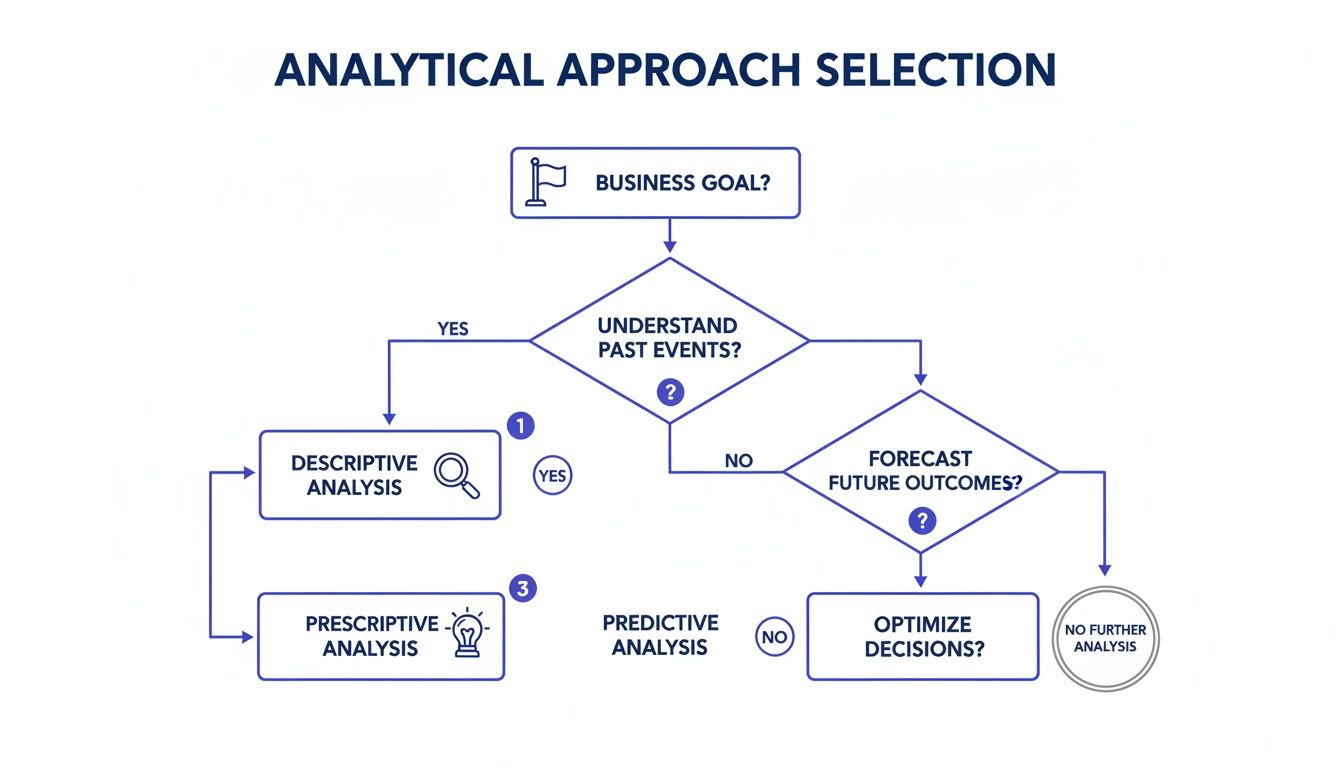
- Start with the business problem: Choose your analysis based on whether you need to understand the past (descriptive), predict the future (predictive), or decide the next best action (prescriptive).
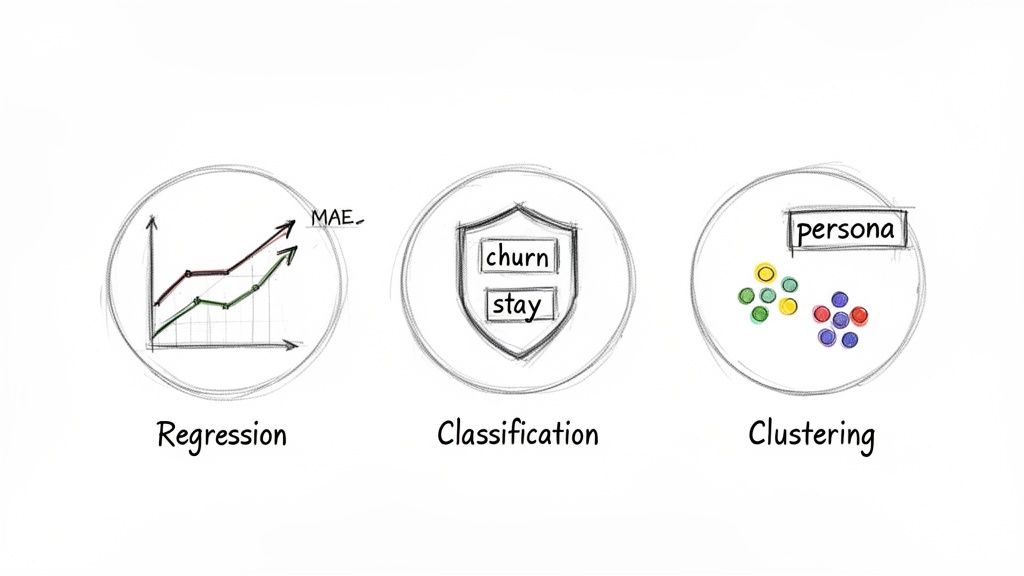
- For predictive analytics, choose the right tool: Use Regression to forecast numbers (e.g., revenue), Classification to predict categories (e.g., churn), and Clustering to find hidden groups (e.g., customer personas).
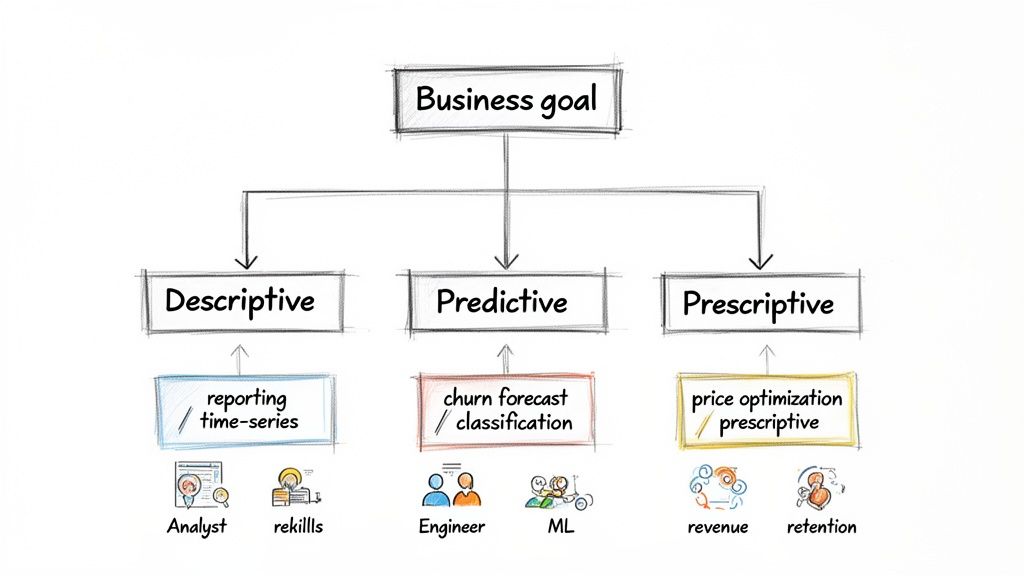
- Build your team based on your biggest bottleneck: Hire a Data Analyst to create reports, a Data Engineer to fix messy data pipelines, and an ML Engineer to build predictive models. Start lean.
- Actionable Framework: Use our Decision Framework table to match your business problem to the correct analysis type, technique, and required team skills to ensure your efforts drive real-world impact.
Who this is for
This guide is for CTOs, Heads of Engineering, and Founders at early-stage tech companies who must make data-driven decisions within weeks, not months.
You're in the right place if you need to:
- Scope the budget and team for a new AI feature.
- Decide whether to hire a data analyst, data engineer, or ML engineer first.
- Turn raw business data into actionable insights that reduce churn, increase revenue, or improve user engagement.
We skip the academic theory and provide a practical playbook for operators who need to act now.
Quick Answer: The 3-Step Analysis Framework
The fastest way to turn data into business impact is to connect your goal to the right analytical method. Don't start with algorithms; start with the business question.
- Define Your Goal: What business outcome are you trying to achieve? (e.g., "Reduce customer churn," "Improve sales forecasting accuracy").
- Descriptive: What happened? (e.g., "Our user engagement dropped 15% last week.")
- Predictive: What will likely happen? (e.g., "This user segment has a 70% probability of churning next month.")
- Prescriptive: What should we do about it? (e.g., "Offer at-risk users a 10% discount to prevent churn.")
- Select the Technique: Pick the specific technical method that aligns with your chosen analysis type.
- Business Problem: High, unpredictable customer churn was impacting monthly recurring revenue (MRR).
- Analysis Type: Predictive. The goal was to identify which customers were likely to churn before they did.
- Technique Used: Classification. The team hired a contract ML Engineer who built a logistic regression model. The model was trained on historical user data, including transaction frequency, session length, and support ticket history.
- Business Impact: The model identified at-risk customers with 85% accuracy. A new automated workflow then offered these users a small incentive to stay. The result was a 12% reduction in monthly churn within the first quarter, saving an estimated $25,000 in lost MRR.
- Business Problem: Inefficient marketing spend with low return on investment (ROI).
- Analysis Type: Descriptive (Diagnostic). The goal was to understand why campaigns weren't performing by uncovering hidden customer segments.
- Technique Used: Clustering. A data analyst used the K-Means algorithm on purchasing data (average order value, purchase frequency, product categories).
- Business Impact: The analysis revealed three distinct customer personas: "Bargain Hunters," "Luxury Shoppers," and "Seasonal Buyers." The marketing team created tailored campaigns for each. This led to a 35% increase in email engagement and a 15% uplift in conversion rate for targeted campaigns.
- Descriptive Analysis: What happened?
- Diagnostic Analysis: Why did it happen?
- Predictive Analysis: What will happen next?
- Prescriptive Analysis: What should we do about it?
- Define the Business Problem: Clearly state the problem in terms of cost, revenue, or risk (e.g., "We are losing $10k/month to customer churn").
- Identify the Key Metric: What single number will tell you if you've succeeded? (e.g., "Reduce churn rate by 15%").
- Choose the Analysis Type: Is this descriptive, predictive, or prescriptive?
- Inventory Your Data: Do you have the necessary data? Is it clean and accessible?
- Assign the Right Role: Is this a job for a Data Analyst (reporting), Data Engineer (pipelines), or ML Engineer (modeling)?
- Define a 2-Week Pilot: What is the minimum viable analysis you can deliver in 10 business days to prove value?
- Set the Success Criteria: How will you measure the ROI? (e.g., "The model must detect fraud with >90% precision").
- Confirm Data Access: Does the assigned person have access to the data warehouse (e.g., BigQuery, Snowflake)?
- Select the BI/Modeling Tool: Will you use a BI tool (Metabase, Tableau) or a Python environment?
- Plan for Production: If this is a model, how will you deploy and monitor it?
- Scope Your First Pilot: Use the checklist above to define a small, high-impact data analysis project you can execute in the next two weeks.
- Assess Your Team: Identify whether your biggest bottleneck is in reporting (need an Analyst), data infrastructure (need a Data Engineer), or prediction (need an ML Engineer).
- Book a Scoping Call: If you need to fill a talent gap, let's talk. ThirstySprout connects you with vetted, senior AI and data experts ready to start in days.
- A Brief History of Data Analysis (GeeksForGeeks)
- History of Data Analytics (Noble Desktop)
- Data Visualization Best Practices (ThirstySprout)
- Best Data Pipeline Tools (ThirstySprout)
- How to Detect Anomalies in Time Series (ThirstySprout)
This flow ensures you don't over-engineer a solution and always focus on the fastest path to a valuable answer.
Practical Examples of Data Analysis in Action
Theory is good, but results are better. Here are two real-world examples of how choosing the right data analysis techniques drives business outcomes.
Example 1: Reducing Customer Churn with Classification
A Series A fintech app was losing customers but didn't know why. Their manual review process for at-risk accounts was slow and ineffective.
Example 2: Optimizing Marketing Spend with Clustering
An e-commerce startup's marketing felt generic, and conversion rates were flat. They suspected they were treating all customers the same.
Deep Dive: The Four Levels of Data Analysis
To build truly smart AI products, you need to think about data analysis in four distinct stages. Each level builds on the last, answering a more sophisticated question that moves your team from just reporting on the past to actively shaping the future.
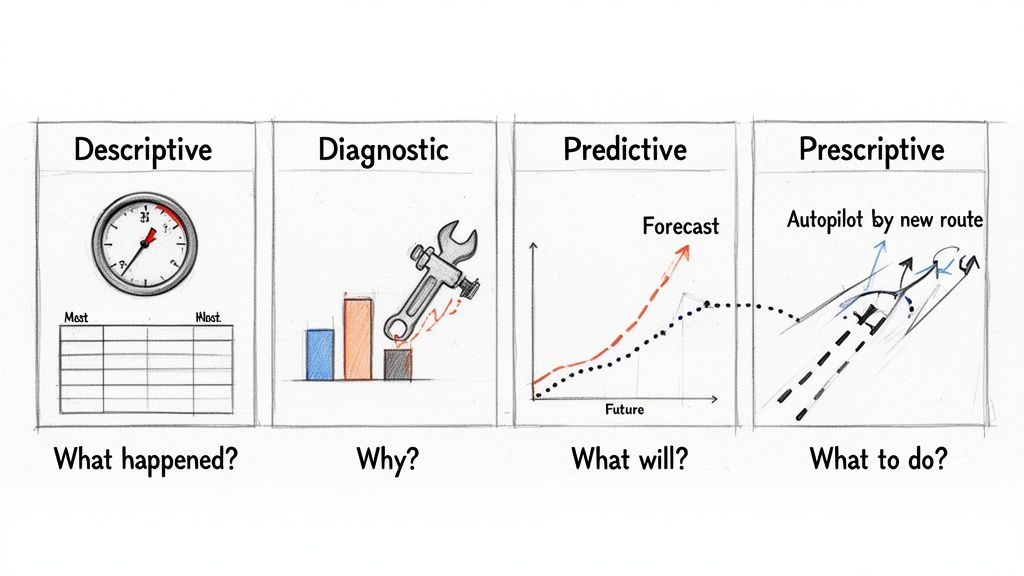
The four levels are:
Understanding this progression is what separates teams that just look at dashboards from those who build a genuinely data-driven strategy.
Level 1: Descriptive Analysis
This is your starting point. Descriptive analysis looks at historical data to give you a clear picture of what happened. It powers business intelligence (BI) dashboards, website traffic reports, and sales summaries.
Business Example: A product manager at a SaaS company sees that Daily Active Users (DAU) dropped by 15% last week. The report shows the trend but doesn't explain the cause.
Level 2: Diagnostic Analysis
Once you know what happened, the next question is why it happened. Diagnostic analysis is the investigative work to find the root cause. This involves slicing the data and looking for anomalies.
Business Example: The product team runs a contribution analysis. They discover the entire DAU drop came from users on a specific mobile operating system after a recent OS update introduced a login bug. Now they know why.
Level 3: Predictive Analysis
This is where you shift from looking backward to looking forward. Predictive analysis uses historical data and machine learning to forecast what will likely happen. This helps you get ahead of trends and risks. Modern AI data analysis tools often accelerate this process.
Business Example: The team builds a predictive model that flags at-risk users based on app version and device type. The model forecasts a 30% churn risk for users who haven't updated their app after the bug fix.
Level 4: Prescriptive Analysis
This is the most powerful level. Prescriptive analysis recommends what action to take for the best outcome. It uses optimization and simulation to suggest the best path forward.
Business Example: The team sets up a prescriptive system. It automatically triggers in-app messages to high-risk users, offering a small incentive to update. This proactively prevents churn and protects revenue.
Checklist: Scoping Your Next Data Analysis Project
Use this checklist to ensure your next data project is set up for success from day one.
Project Scoping (1-2 Hours)
Team & Execution (1 Day)
Tooling & Stack
What to do next
Ready to build a high-impact data team? ThirstySprout helps you hire vetted, senior AI and data experts in days, not months. Start a Pilot.
References & Further Reading
The preserved media element and all other original images and links have been maintained in their respective sections as requested.
Hire from the Top 1% Talent Network
Ready to accelerate your hiring or scale your company with our top-tier technical talent? Let's chat.