
TL;DR
- Start with Business Impact: Before choosing an algorithm, define what an anomaly costs your business. A revenue-losing outage needs a different solution than a minor engagement dip.
- Use a Simple Baseline First: Don't jump to deep learning. Start with statistical methods (like ARIMA) or simple forecasting (like Prophet) to catch 80% of obvious issues and set a performance benchmark.
- Scale to ML When Necessary: For complex, non-linear patterns, use unsupervised models like Isolation Forest. They are efficient and don't require pre-labeled anomaly data.
- Measure Precision and Recall: Standard accuracy is useless. Focus on precision (minimizing false alerts for your on-call team) and recall (catching every critical event, like fraud).
Who this is for
- CTOs & Heads of Engineering: You need to build a reliable monitoring system that protects revenue and system uptime without over-engineering or creating alert fatigue for your team.
- Product & Data Leads: You need to translate system behavior into business metrics, spotting issues like customer churn or feature disengagement before they escalate.
- Founders: You need a pragmatic approach to anomaly detection that delivers value quickly and justifies the engineering investment.
Quick Framework: A 4-Step Plan for Anomaly Detection
Your job isn't just to find outliers; it's to build a system that safeguards revenue, enhances user experience, or ensures system reliability. This step-by-step framework helps you move from a vague problem to a production-ready solution without over-engineering.
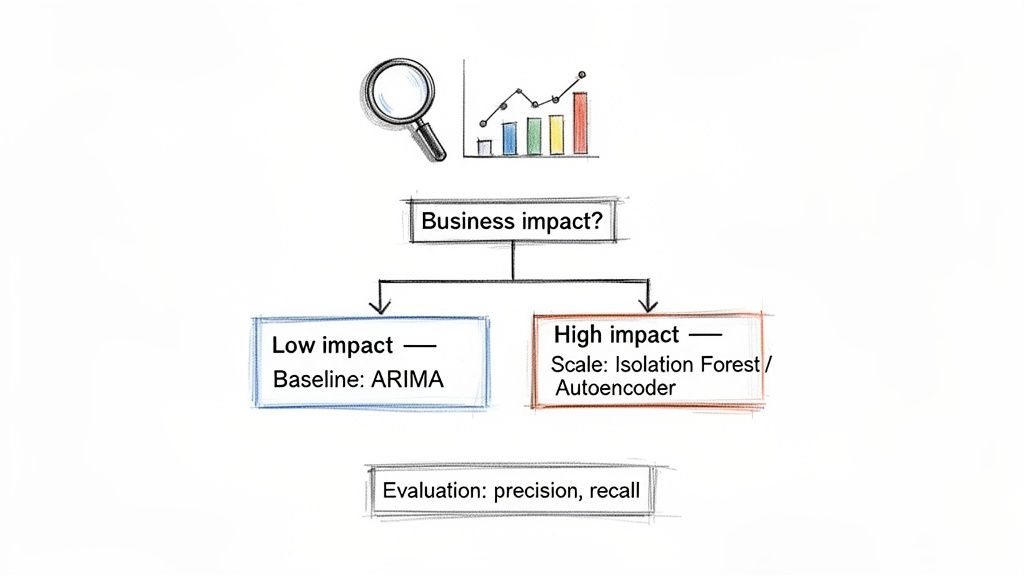
Alt text: A flowchart illustrating anomaly detection strategies based on business impact, using various machine learning models.
Step 1: Define the Business Objective.
What are you trying to prevent or achieve? A fintech platform monitoring transactions needs to flag fraud in milliseconds. A SaaS company tracking daily active users can tolerate a few hours' delay. This dictates your entire technical strategy.
Step 2: Start with a Simple Baseline.
Resist jumping to a complex deep learning model. Start with something simple and interpretable, like an ARIMA (Autoregressive Integrated Moving Average) or Exponential Smoothing model. This will catch most obvious anomalies and give you a clear metric to beat. Any complex model must outperform this baseline to justify its cost. This is a core principle of effective MLOps best practices.
Step 3: Scale to Machine Learning When Needed.
Once you've exhausted statistical methods, level up. When data contains complex, non-linear relationships, machine learning is the next logical step. For many scenarios, an unsupervised model like Isolation Forest is perfect. It's computationally efficient and works well without needing labeled anomaly data, which most teams lack.
Step 4: Measure Success from Day One.
Establish clear evaluation metrics before writing any code. Anomaly detection is a "needle in a haystack" problem, making standard accuracy useless. Focus on metrics tied to business value:
- Precision: What percentage of alerts were actual problems? High precision reduces alert fatigue.
- Recall: What percentage of actual problems did we catch? High recall is critical for fraud detection, where missing one event is costly.
Practical Examples: Anomaly Detection in the Real World
Theory is great, but seeing how this works in practice makes it click. Here are two common scenarios where teams applied these principles.
Example 1: SaaS Startup Monitoring User Engagement (Batch Processing)
A Series A SaaS company needs to monitor the number of tasks users create per hour. A sudden drop could signal a critical bug. They need a simple, effective way to establish a "normal" activity baseline.
- Problem: Detect a sustained drop in user activity that could indicate a broken feature or UI bug.
- Solution: They use Facebook's Prophet library because it handles seasonality (like weekend dips) automatically.
- Architecture: A simple cron job runs hourly. It fits a Prophet model to historical data, predicts the expected task count for the next hour, and generates a confidence interval (
yhat_lowerandyhat_upper). - Logic: If the actual task count falls below
yhat_lower, it triggers an alert to a Slack channel.
Here is a representative Python snippet:
# 'df' is a pandas DataFrame with 'ds' (timestamp) and 'y' (task count)from prophet import Prophet# Initialize and fit the modelmodel = Prophet(daily_seasonality=True, weekly_seasonality=True)model.fit(df)# Forecast the next hourfuture = model.make_future_dataframe(periods=1, freq='H')forecast = model.predict(future)# Get the most recent actual value and its lower bound forecastactual_value = df['y'].iloc[-1]expected_lower_bound = forecast['yhat_lower'].iloc[-1]# If the actual is below the expected floor, it's an anomalyif actual_value < expected_lower_bound:print("Anomaly Detected: Task creation is unexpectedly low!")# Trigger alert to Slack or PagerDutyThis batch-based approach is quick to implement, easy to understand, and perfect for this use case. This same logic can be applied in finance for understanding unusual stock volume.
Example 2: Fintech App Building Real-Time Fraud Detection (Stream Processing)
A fintech company processing thousands of transactions per second must spot fraud in milliseconds. Latency is a core business requirement, demanding a sophisticated streaming architecture.
- Problem: Detect individual fraudulent transactions (point anomalies) in real-time to prevent financial loss.
- Solution: An Isolation Forest model, which is fast and handles high-dimensional data efficiently.
- Event Streaming: Transactions are pushed into an Apache Kafka topic.
- Stream Processing: A Flink or Spark Streaming job consumes events, enriching them with historical features from a low-latency database like Redis (e.g., user's average transaction amount).
- Model Inference: The enriched data is sent to an Isolation Forest model hosted on an AWS SageMaker endpoint.
- Decision: If the model's anomaly score crosses a threshold, the transaction is flagged for blocking or manual review.
- Handling Missing Values: Use simple fixes like forward-filling (carrying the last known value forward) or a moving average.
- Normalization: Scale all data to a common range (like 0 to 1) to prevent features with large values from dominating the model. A solid data foundation requires a reliable pipeline; see our guide on the best data pipeline tools to get started.
- Time-Based Features: Extract day-of-week, hour-of-day, or an is_holiday flag. This helps the model learn the natural rhythms of your business.
- Rolling Statistics: Calculate rolling averages or standard deviations over a set window (e.g., the last 24 hours) to smooth out noise and establish a dynamic baseline for "normal."
- Point Anomalies: A single data point is wildly different from others (e.g., a $15,000 fraudulent transaction vs. a user's typical $50 spend). A quick look at the data's five-number summary would make this jump out.
- Contextual Anomalies: The value is normal, but the timing is wrong (e.g., 95% server CPU at 3 AM on a Sunday). Effective visualization can help spot these; learn more in our guide on data visualization best practices.
- Collective Anomalies: A group of seemingly normal points forms a suspicious pattern (e.g., a slight but sustained drop in daily logins over two weeks, signaling churn).
- Open Source (Prophet, PyOD): Total flexibility and no vendor lock-in. You are responsible for all infrastructure, scaling, and maintenance. Best for teams with strong MLOps skills.
- Managed Services (Amazon Lookout for Metrics, Vertex AI): Faster time-to-market as the provider handles infrastructure. You sacrifice some flexibility, and costs can grow. Ideal for teams focused on speed and business logic.
- Serverless (AWS Lambda): For real-time, low-latency needs. Cost-efficient and auto-scaling.
- Batch Jobs (AWS Batch): For scheduled analysis (daily or hourly). Cheaper for non-urgent use cases.
- Tier Your Alerts: Use P1 alerts for critical events and Slack/email for less urgent issues.
- Consolidate Reports: Group related events into a single summary to avoid noise.
- Human-in-the-Loop: Build a simple UI for domain experts to label flagged anomalies. This feedback is invaluable for retraining your model, a technique used to analyze major events in powerful statistical findings on otexts.com.
- Identify one high-impact metric. Choose a time series where anomalies have a direct and painful business consequence (e.g., user signups, server error rates).
- Define the "win" for the pilot. What does success look like? (e.g., flagging one legitimate, previously unnoticed issue).
- Select a simple baseline model. Use a Z-score, moving average, or a simple forecasting library like Prophet.
- Assemble a lean team. You need one Data Engineer (for the pipeline) and one Machine Learning Engineer (for the model and logic).
- Build the data pipeline. Ingest data reliably from its source.
- Implement the baseline model. Write the detection and alerting logic.
- Set up a basic alert. Connect the model's output to a Slack channel or email.
- Review initial results. Manually check the first few days of alerts with stakeholders to confirm value.
- Document pilot findings. Show the value delivered and lessons learned.
- Map out the production architecture. Make decisions on open-source vs. managed services and deployment patterns.
- Secure resources for a full build. Use the pilot's success to justify further investment.
- Scope a One-Week Pilot: Identify a single, high-impact time series metric and define what a successful pilot looks like.
- Assign a Lean Team: Pair a Data Engineer with an ML Engineer to build the initial pipeline and model.
- Book a Scoping Call: If you need to move faster, we can connect you with vetted engineers who have built these systems before. Get a production-ready pilot live in 2–4 weeks.
- Hyndman, R.J., & Athanasopoulos, G. (2021). Forecasting: principles and practice, 3rd edition, OTexts: Melbourne, Australia. OTexts.com/fpp3. Accessed on [DATE].
- Chandola, V., Banerjee, A., & Kumar, V. (2009). Anomaly detection: A survey. ACM computing surveys (CSUR), 41(3), 1-58.
- Facebook's Prophet Documentation. (https://facebook.github.io/prophet/)
- scikit-learn Isolation Forest Documentation. (https://scikit-learn.org/stable/modules/generated/sklearn.ensemble.IsolationForest.html)
This real-time system is more complex but non-negotiable for this business, illustrating a production-grade system designed to detect anomalies in time series where every millisecond counts.
Deep Dive: The Anomaly Detection Workflow and Trade-offs
Building a robust system requires a structured process, from cleaning data to deploying a model that adds real value.
Step 1: Data Preparation and Feature Engineering
Real-world data is messy. Before modeling, you must handle missing values and inconsistent scales.
Raw data rarely tells the full story. Engineering features provides the context needed to distinguish normal fluctuations from real problems.
Step 2: Choosing the Right Model
Your model choice depends on data complexity, anomaly types, and operational constraints. Most anomalies fall into three types:
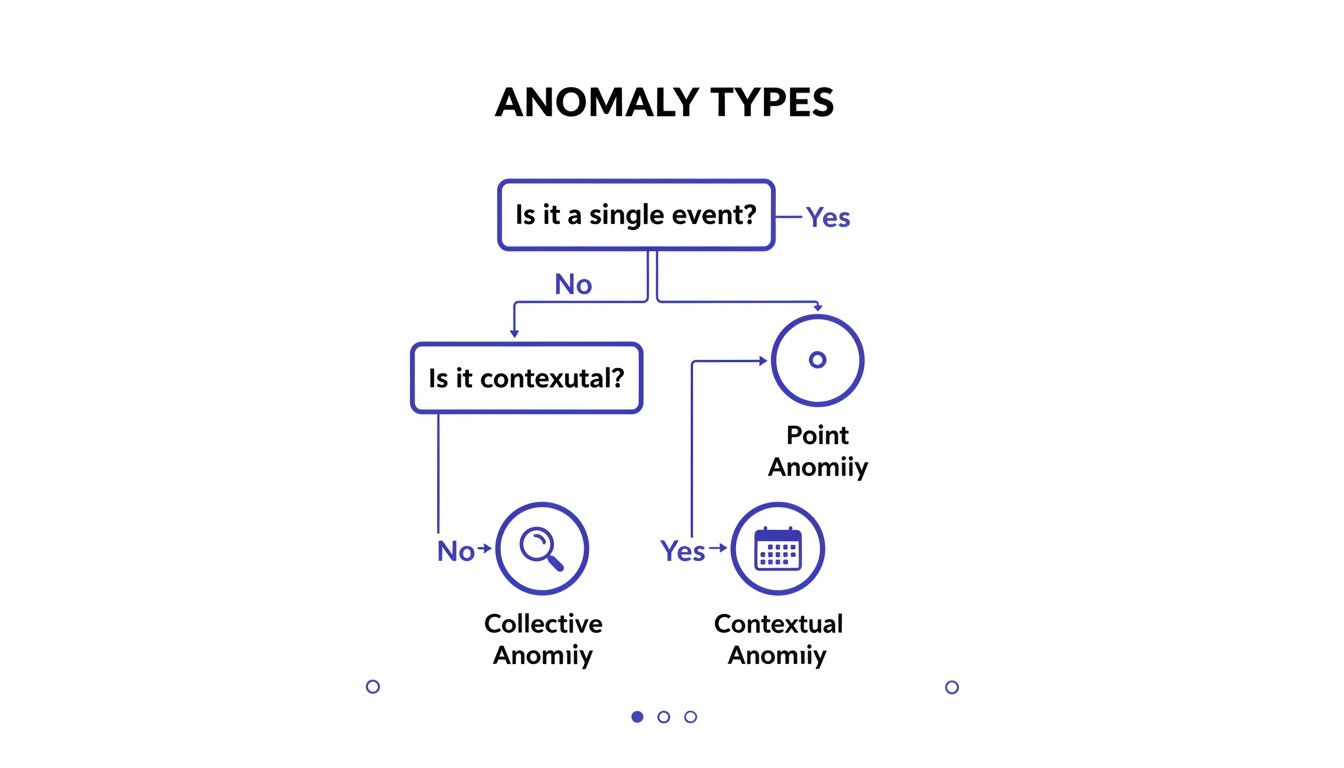
Alt text: Flowchart illustrating anomaly types: Point, Contextual, and Collective, based on event and context.
Use this table to select a method based on your data and team skills.
Step 3: MLOps and Deployment
A great model is useless if it's not reliable in production. A solid Machine Learning Operations (MLOps) plan is essential.
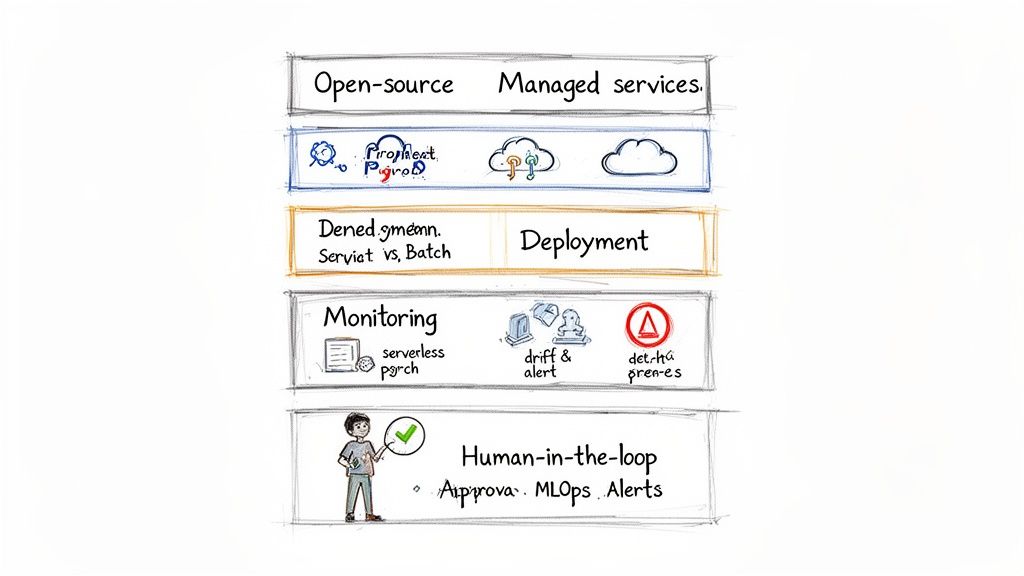
Alt text: A layered MLOps diagram illustrating open-source, managed services, deployment, monitoring, and human-in-the-loop processes.
Open Source vs. Managed Services
Deployment Pattern
Monitoring and Alerting
Monitor for concept drift—a slow decay in performance as real-world data patterns change. Automate retraining when accuracy drops.
Checklist: Launching Your Anomaly Detection Pilot
Use this checklist to get from idea to a working pilot quickly.
Phase 1: Scoping (Week 1)
Phase 2: Build & Deploy (Weeks 2–3)
Phase 3: Plan for Production (Week 4)
What to do next
References
Hire from the Top 1% Talent Network
Ready to accelerate your hiring or scale your company with our top-tier technical talent? Let's chat.