
TL;DR: Key Takeaways on PCA
- What it is: Principal Component Analysis (PCA) is a technique for dimensionality reduction. It simplifies complex datasets by converting many variables into a smaller set of 'principal components' that capture most of the original information.
- Why it matters: Using PCA leads to faster model training, lower cloud compute costs, and can reduce overfitting by removing noise. The business impact is a quicker time-to-value for AI projects.
- How to use it: Apply PCA when you have a large number of correlated features and your primary goal is prediction speed, not feature interpretability.
- Key trade-off: PCA improves efficiency but makes model results harder to explain in simple business terms, as the new components are abstract mathematical combinations.
Who This Guide Is For
This guide is for technical leaders, product owners, and talent managers who need to scope, budget, and execute AI projects effectively. It's written for operators who must make decisions in weeks, not months.
- CTO / Head of Engineering: You need to decide if PCA is the right architectural choice for your ML pipeline to reduce costs and accelerate model training.
- Founder / Product Lead: You're scoping an AI feature and need to understand the trade-offs between model performance, development time, and budget.
- Talent Ops / Procurement: You're evaluating candidates or vendors for an ML project and need to know what practical PCA experience looks like.
The 4-Step PCA Framework
At its core, Principal Component Analysis (PCA) is a cornerstone of machine learning used for dimensionality reduction. Its main job is to take a complex, high-dimensional dataset and simplify it without throwing away essential information. It finds the underlying patterns—the "principal components"—that account for the most variation in your data.
Think of it as creating an executive summary from a dense report. You keep the critical plot points and remove the fluff.
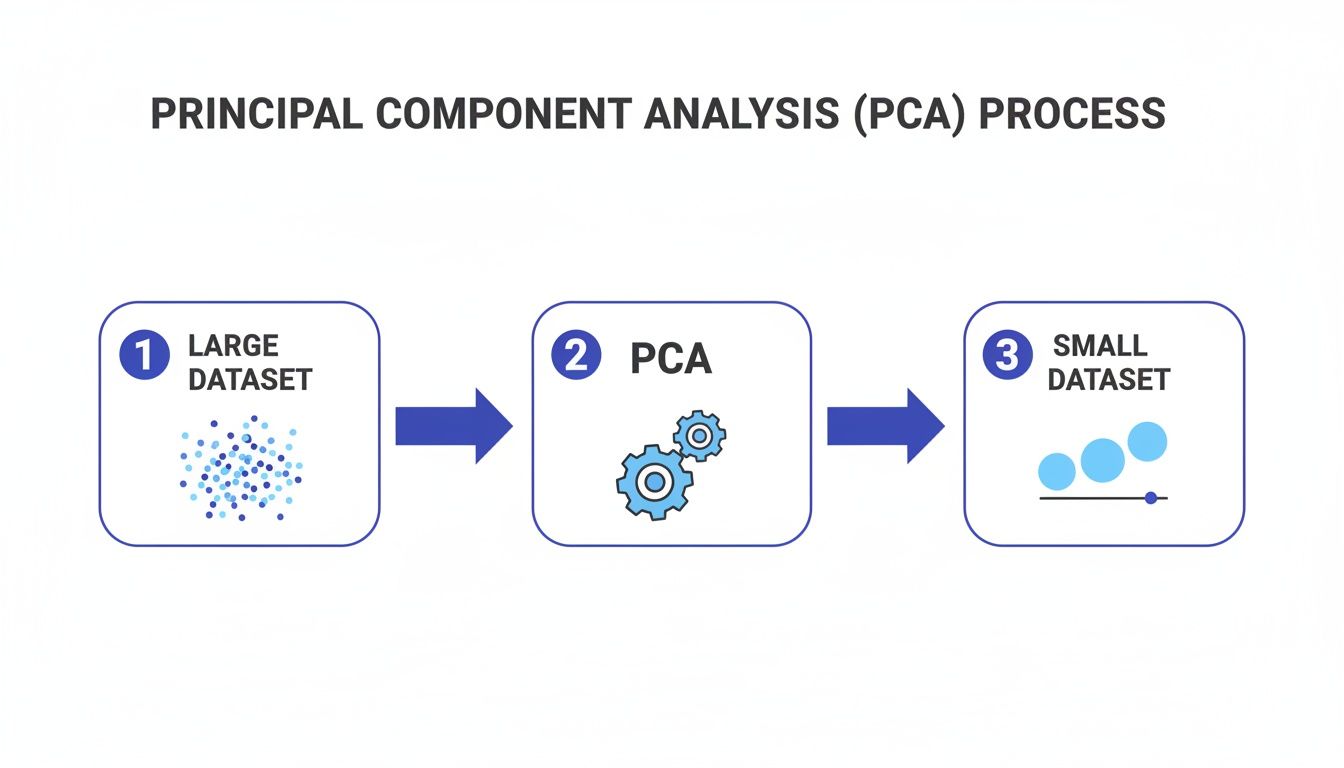
Here is a step-by-step breakdown of how it works in practice.
Step 1: Standardize the Data
Before you can do anything, all features must be on a level playing field. If you have age (20-70) and annual_income ($50k-$500k), the larger income numbers would dominate the analysis. Standardization rescales every feature to have a mean of 0 and a standard deviation of 1, ensuring all features are weighted equally. This step is non-negotiable.
Step 2: Compute the Covariance Matrix
Next, you map how all the features move together using a covariance matrix. This grid shows the relationship between every pair of features. A positive covariance means they trend together; a negative covariance means they move in opposite directions. This matrix is the blueprint PCA uses to find the underlying data structure.
Step 3: Calculate Eigenvectors and Eigenvalues
Using a process called eigendecomposition on the covariance matrix, you extract two key pieces of information:
- Eigenvectors: These define the directions of your new axes—the principal components. They are designed to be uncorrelated (perpendicular), each capturing an independent pattern.
- Eigenvalues: These are numbers that tell you how much information (variance) each eigenvector captures. A high eigenvalue means its component is very important.
Step 4: Select Principal Components and Transform
Finally, you rank the eigenvectors by their eigenvalues, from highest to lowest. You decide how many components to keep, typically enough to explain 90-95% of the total variance. This is the core trade-off: you discard low-eigenvalue components (the "noise") to reduce complexity while retaining high-eigenvalue components (the "signal"). This new, smaller set of components becomes the input for your model. To learn how to effectively present these kinds of data-driven insights, check out our guide on data visualization best practices.
2 Practical Examples of PCA in Business
Theory is one thing, but where does PCA actually impact the bottom line? Let's walk through two common scenarios where it directly boosts model performance and slashes operational costs.
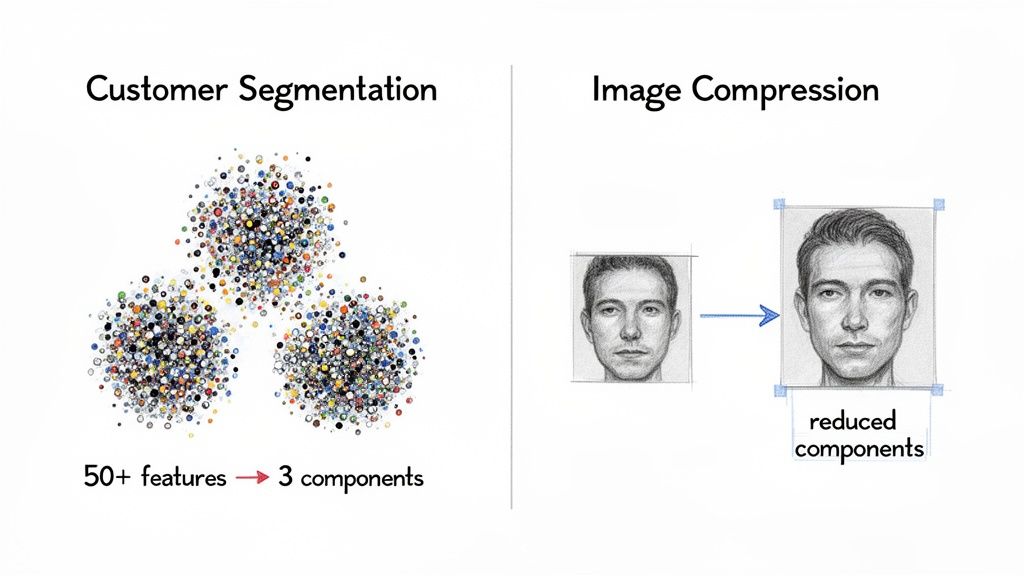
Example 1: Optimizing Customer Segmentation for a SaaS Company
Situation: A growing SaaS startup tracks 50+ user metrics (daily logins, features used, session duration, support tickets). Their goal is to use k-means clustering to segment users for targeted marketing, but the model is slow and produces unclear results.
- The Problem: With 50+ features, many are correlated (e.g., more logins often mean longer session times). This noise and redundancy, known as the "curse of dimensionality," confuses the clustering algorithm.
- The PCA Solution: An ML engineer applies PCA to the dataset. After plotting the explained variance, they find that just 3–5 principal components capture over 90% of the information from the original 50+ features.
- The Business Impact: Instead of using 50+ dimensions, the team now feeds just 3–5 into their clustering model. This delivers a 70-80% reduction in model training time. The resulting customer segments are far more distinct because they are built on the true underlying patterns of user behavior, not random noise.
Interview Question for ML Engineers: "You have a customer dataset with 50 features. How would you decide if PCA is appropriate for a segmentation project, and what's the first plot you would generate to make your decision?" A strong answer will mention checking for correlated features and plotting the cumulative explained variance (a scree plot).
Example 2: Streamlining Image Data for Visual Quality Assurance
Situation: A manufacturing company uses a computer vision system for quality assurance (QA). A neural network analyzes high-resolution 1024x1024 pixel images to spot defects. With over 1 million features per image, model training is painfully slow and expensive.
- The Problem: Training a deep learning model on millions of pixels demands immense GPU power and time. Each experiment can take days, slowing down development and increasing cloud computing bills.
- The PCA Solution: Before feeding images to the model, the team uses PCA for compression. By keeping only the top principal components, they can represent each image with a fraction of the original data while preserving the essential details needed to identify defects.
- The Business Impact: The smaller dataset radically cuts model training time and resource consumption. The team can iterate on model architectures faster, accelerating the timeline for deploying an accurate QA system.
This trade-off analysis is critical for project planning. The table below shows a typical decision matrix for this scenario.
| Number of Components | Explained Variance | Model Training Time (Hours) | Inference Latency (ms) | Defect Detection Accuracy |
|---|---|---|---|---|
| 500 | 99% | 24 | 150 | 98.5% |
| 250 | 95% | 12 | 80 | 98.2% |
| 100 | 88% | 5 | 45 | 96.1% |
| 50 | 75% | 2 | 25 | 92.4% |
The data shows a clear sweet spot. Reducing components from 500 to 250 cuts training time in half with a negligible 0.3% drop in accuracy. This is a powerful, data-driven trade-off for a more agile and cost-effective development process. Deciding how many components to keep is a common decision point in many data analysis techniques.
Deep Dive: Trade-offs, Limits, and Alternatives
PCA is a workhorse, but it’s not a magic wand. Knowing when to use it—and when to avoid it—is critical for making smart architectural decisions.
When to Use PCA
- To Accelerate Model Training: If you have a dataset with hundreds or thousands of features, PCA can shrink the feature set to speed up training cycles and lower cloud costs. It’s a pragmatic choice for getting results quickly.
- To Improve Model Performance: When many of your features are correlated (multicollinearity), algorithms like linear or logistic regression can get confused. PCA creates new, uncorrelated components, cleaning up redundant signals and helping these models perform better.
- To Visualize High-Dimensional Data: You can’t plot a dataset with 50 dimensions. PCA can distill that complexity down to two or three components, which you can then plot to spot clusters, find outliers, and understand the underlying structure.
Critical Limitations and When to Avoid PCA
- You Need Full Interpretability: This is PCA's biggest catch. The principal components are abstract mixtures of your original features. You can't look at "Component 1" and easily explain what it means in business terms. For regulated industries like finance or healthcare, this is often a deal-breaker.
- Your Data Has Non-Linear Relationships: PCA is a linear algorithm. If the true patterns in your data are curved or complex, PCA will miss them. You are better off with non-linear techniques like t-SNE or UMAP.
- You Haven't Scaled Your Data: You must standardize your data before applying PCA. If one feature ranges from 1-10 and another from 10,000-1,000,000, the larger-scale feature will dominate the analysis and produce useless results.
Decision Framework: If your primary goal is prediction speed and you can accept a "black box" feature set, PCA is a fantastic choice. If your project demands clear, human-readable feature importance for regulatory or business reasons, you should stick to other methods like feature selection or explore other explainable AI (XAI) techniques.
Checklist for Scoping a PCA Project
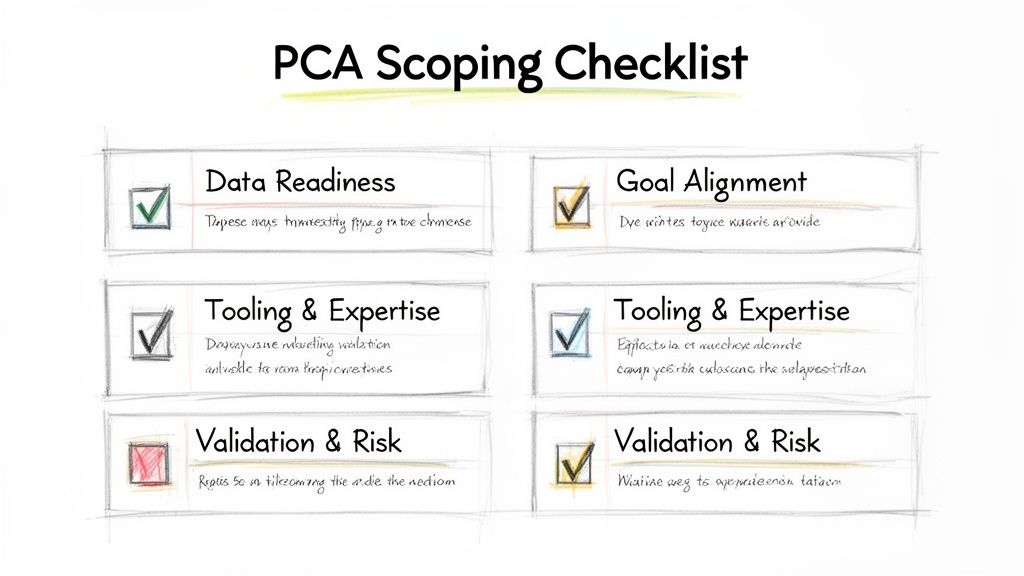
Before committing resources, run through this checklist with your team to ensure alignment on goals, trade-offs, and success metrics.
Project Scoping Checklist
[ ] Data Readiness: Are all features scaled?
Have you standardized all numerical features to have a mean of 0 and a standard deviation of 1? This is non-negotiable.
[ ] Data Readiness: How are missing values handled?
Define a strategy for nulls: will you impute them (e.g., with the mean/median) or drop rows?
[ ] Goal Alignment: What is the primary objective?
Is it to speed up training, reduce cost, improve model accuracy, or visualize data? The answer dictates how many components you will keep.
[ ] Goal Alignment: What is the target for explained variance?
A common goal is 90-95%, but this must align with your model's real-world accuracy needs.
[ ] Tooling & Expertise: Is your tooling appropriate for the data scale?
For most use cases, scikit-learn is sufficient. For massive datasets, a distributed option like Spark’s PCA might be necessary. Find more comparisons in our guide to the best data pipeline tools.
[ ] Risk & Validation: Is a "black box" feature set acceptable?
Get explicit buy-in from business stakeholders that a loss of direct feature interpretability is an acceptable trade-off for the performance gains.
[ ] Risk & Validation: What are the success metrics?
Define clear KPIs upfront. Are you targeting a specific % reduction in training time, a measurable lift in model accuracy, or lower inference latency?
What to Do Next: Putting PCA Into Practice
Moving from theory to a production environment is where you see the real value. Here’s a low-risk, 3-step plan to see if PCA can deliver value for your team.
- Identify Your First Target: Find a model in your current ML pipeline that is slow to train or expensive to run due to a large feature set. This is your perfect candidate for a pilot.
- Run a 2-Week Experiment: Task an engineer to apply PCA to the target dataset and measure the impact. Document the changes in training time, inference latency, and model accuracy to build a business case.
- Bring in Proven Experience: If your team is stretched thin or lacks deep expertise in dimensionality reduction, get support. Working with a senior ML engineer who has successfully implemented PCA before can prevent common mistakes and accelerate your results.
At ThirstySprout, we specialize in connecting companies with top-tier ML engineers who can execute this kind of pilot in weeks, not months. If you’re ready to see how PCA can optimize your ML pipeline, let's discuss a pilot.
Start a Pilot
References & Further Reading
For a deeper understanding of the concepts discussed, we recommend the following primary sources and related guides:
- t-SNE: Original research and documentation by Laurens van der Maaten.
- UMAP: Official documentation for the UMAP algorithm.
- Standard Deviation: A foundational statistics concept explained in this guide.
- Data Visualization Best Practices: A ThirstySprout guide on presenting data insights effectively.
- Data Analysis Techniques: An overview of other methods in our comprehensive guide.
- Data Pipeline Tools: A comparison of modern tools for building ML systems from ThirstySprout.
Hire from the Top 1% Talent Network
Ready to accelerate your hiring or scale your company with our top-tier technical talent? Let's chat.