

Debug logs are the most detailed, developer-focused log level, capturing variable values, function calls, and execution paths. Teams usually enable them through trace flags or debug settings for scoped troubleshooting, rather than treating them as always-on telemetry.
At 2 a.m., an AI support copilot returns a confident but incorrect answer. The INFO log says the request completed. The ERROR log says nothing failed. The product team still needs to know why the system selected the wrong document, which retrieval branch ran, and what the model received.
That gap is where debug logging earns its place. A well-designed debug session can reveal the execution path without turning your production environment into an expensive, noisy data warehouse. A poorly governed session can expose credentials, increase system overhead, and leave sensitive customer data accessible long after the incident ends.
This guide is for CTOs, engineering leads, product owners, and MLOps teams responsible for production software and AI systems. You'll learn how debug logs differ from ordinary application logs, how to read their structure, when to enable them, and how to control scope, access, redaction, and retention.
You'll also see two AI-focused examples, a decision framework, and a practical checklist your team can apply during the next investigation. In plain language, a debug log is a detailed record of what an application was doing internally so engineers can reconstruct a failure and find its cause.
"Introduction to Debug Logs for Modern Software Teams"
A production incident usually begins with a symptom. A request times out. A retrieval-augmented generation pipeline cites the wrong source. A model endpoint returns an empty response even though its health check is green.
Your standard logs may tell you that the request arrived, that a service returned an error, or that a job stopped. They often won't tell you which conditional branch ran, what input a function received, or whether a downstream service returned an unexpected payload.
That distinction matters more as systems become distributed. A single AI request can pass through an API gateway, authentication middleware, a retrieval service, a vector database, a prompt builder, a model provider, a tool executor, and a response validator. Each component can report a successful operation while the combined result is wrong.
Why normal logs can stop short
INFO and ERROR logs are designed for operational awareness. They help an on-call engineer identify service health, major state changes, and failures that require attention. They aren't intended to record every internal decision.
Debug logging adds that missing context. It can capture intermediate values, function calls, execution paths, database operations, timings, and interactions with external services. Engineers can then follow the request rather than infer its path from a handful of summary messages.
Practical rule: Use DEBUG to answer a specific diagnostic question. Don't turn it on because “more data” sounds safer.
This is particularly important for product-minded leaders. Debug logs can shorten an investigation, protect customer trust, and prevent repeated incidents. They can also increase storage demand, expose personal data, and complicate access control if nobody owns the operating policy.
What you'll take away
A useful debug logging practice answers four questions before collection begins:
- What failed: Which user journey, service, model call, or data operation needs investigation?
- What detail matters: Which variables, decisions, timings, or external responses can prove the cause?
- What must stay out: Which secrets, credentials, tokens, and personal data require masking or exclusion?
- When does collection end: Who disables the setting, rotates the records, and confirms deletion or restricted retention?
That is the foundation for using debug logs as a governed production capability, not merely a developer convenience.
"What Debug Logs Are and Why They Exist"
Think of ordinary operational logging as an aircraft dashboard and debug logging as the flight recorder. The dashboard shows speed, altitude, and warnings. The recorder preserves a much richer sequence of events, allowing investigators to reconstruct what happened after an incident.
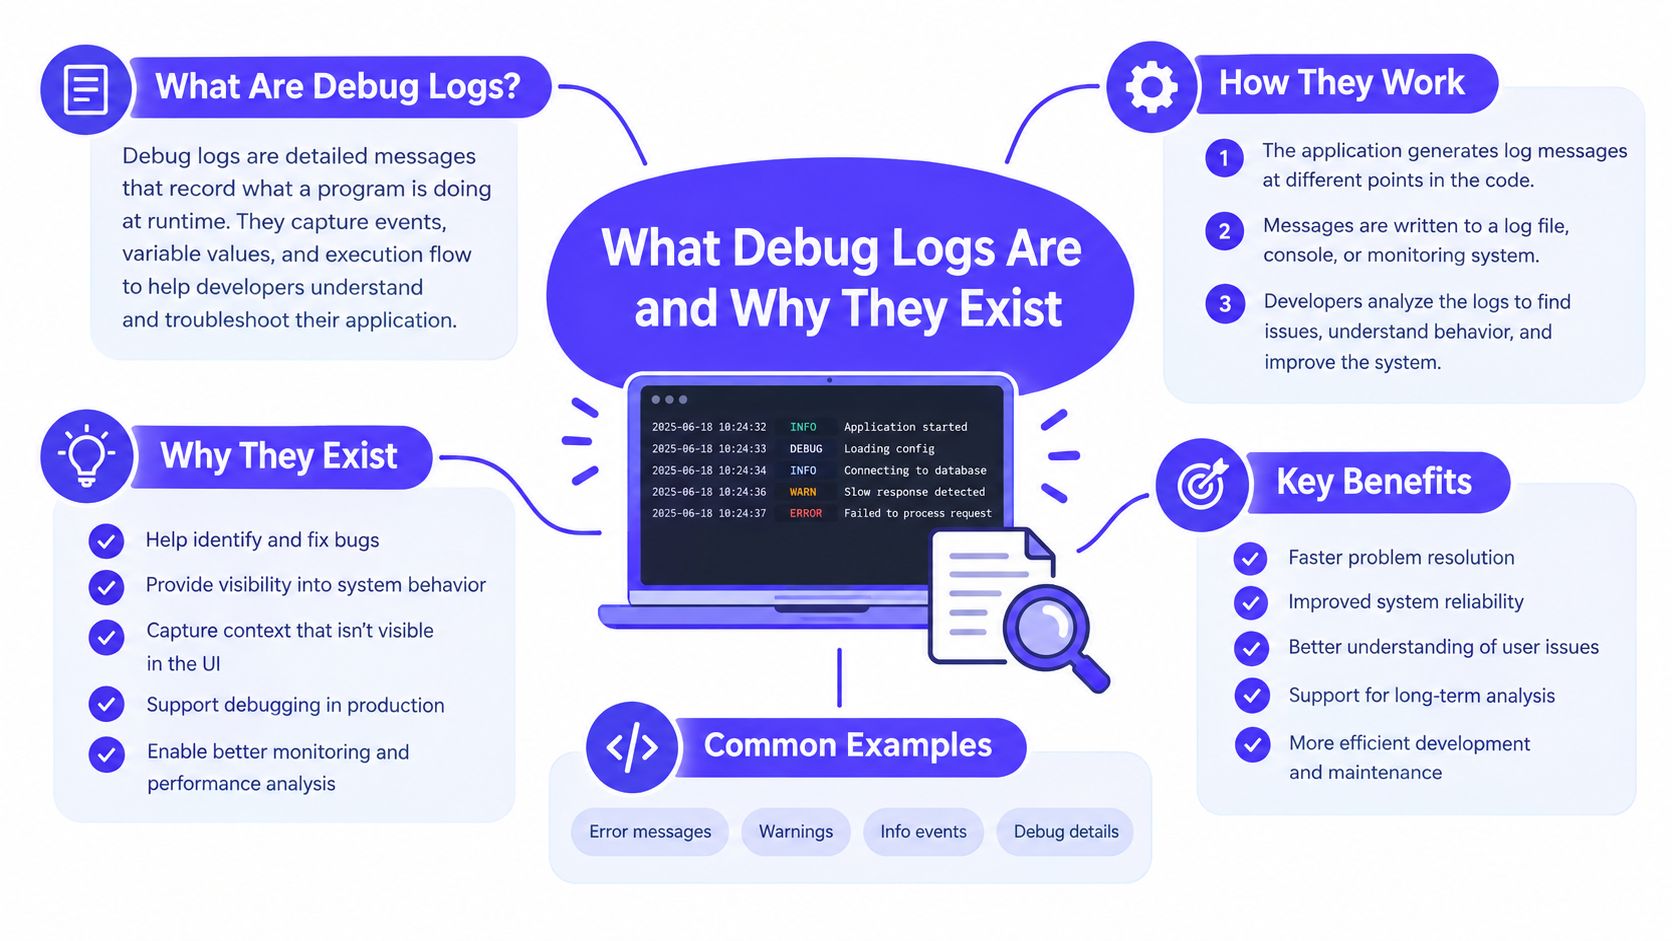
A debug log records detailed runtime activity, including variable values, function calls, system processes, database operations, and errors. That detail helps developers diagnose defects and reconstruct execution flow, as described in Salesforce's documentation on code debug logs.
Build the definition from the request path
Suppose a customer asks an AI assistant, “Can I return this product?” A simplified execution path might look like this:
- The API receives the request and authenticates the user.
- The application classifies the intent.
- A retriever searches policy documents.
- A ranker selects candidate passages.
- A prompt builder combines the question and retrieved context.
- A model generates an answer.
- A validator checks citations and policy compliance.
- The API returns the response.
An INFO log might record that the request completed. A debug session can record the selected intent, retrieval filters, candidate identifiers, ranking decisions, prompt construction state, model response metadata, and validation branch.
You don't need every field for every incident. The purpose is to expose enough internal state to test a hypothesis. If you suspect the retriever used the wrong tenant filter, capture the filter decision and a safe representation of the tenant context. If you suspect a timeout, capture stage timings and downstream status information.
Why DEBUG is usually off
Debug records are much more verbose than ordinary operational logs. Enterprise software therefore commonly generates them only when a trace flag, debug parameter, or equivalent diagnostic setting is enabled. Teams can activate detail for a component, request path, customer environment, or investigation window instead of sending every internal event to the production logging platform.
The historical path explains this design. Early developers often used print statements to inspect program behavior. Centralized logging later made it possible to collect messages, assign levels, and filter events across systems. Unix syslog, introduced in the 1980s, helped establish centralized collection and the practical use of log levels and facilities.
Modern structured debug logs extend that idea. They make internal execution searchable, correlate events across services, and support post-mortem analysis. The operational principle remains simple: collect detail when the question requires it, then return the system to its normal level.
"How Debug Fits Within Log Levels"
Log levels separate messages by importance, urgency, and detail. DEBUG is intended for developers and engineers who need granular diagnostic information. Application frameworks commonly provide levels such as INFO, DEBUG, and ERROR, while the OpenSSF secure-coding guide identifies Python's standard levels as DEBUG, INFO, WARNING, ERROR, and CRITICAL. The distinctions are summarized in this overview of log levels.
| Log Level | Audience and Detail | When to Use |
|---|---|---|
| DEBUG | Developers and engineers. Fine-grained state, execution paths, inputs, decisions, and timings. | Investigate a defined defect or unusual behavior. |
| INFO | Operators and service owners. Normal lifecycle events and meaningful state changes. | Monitor routine operation and major workflow steps. |
| WARNING | Operators and engineers. Conditions that may become failures or need review. | Surface degraded behavior, fallbacks, or unexpected but recoverable states. |
| ERROR | On-call engineers and incident responders. Failed operations or requests. | Record actionable failures with enough context to locate the affected component. |
| CRITICAL | Incident leaders and senior operators. Severe failures affecting a system or essential capability. | Flag conditions that require immediate escalation or coordinated response. |
Severity isn't the same as verbosity
A DEBUG event isn't necessarily less important than an ERROR. It describes a different kind of information. An ERROR might say that a model request failed. DEBUG can show that the request used an outdated endpoint, exceeded a configured timeout, or entered a fallback branch after a validation mismatch.
The choice depends on the question. Use INFO for normal service behavior, WARNING for recoverable concerns, and ERROR for failed operations. Use DEBUG when the summary message doesn't provide enough evidence to determine the cause.
For example, you might enable DEBUG for one failing request path while leaving the rest of the application at INFO. This keeps the investigation focused and reduces the amount of data written, shipped, indexed, and retained.
A practical decision test
Before changing a log level, ask:
- Can INFO, ERROR, metrics, or traces answer the question?
- Which component owns the suspected decision?
- Can you isolate the session by correlation ID or request attribute?
- Which fields would prove or disprove the leading hypothesis?
- Who will disable DEBUG when the evidence is sufficient?
If your team can't answer the final question, don't enable it in production yet. A diagnostic setting without an owner tends to become permanent.
"Inside a Debug Log Format and Example"
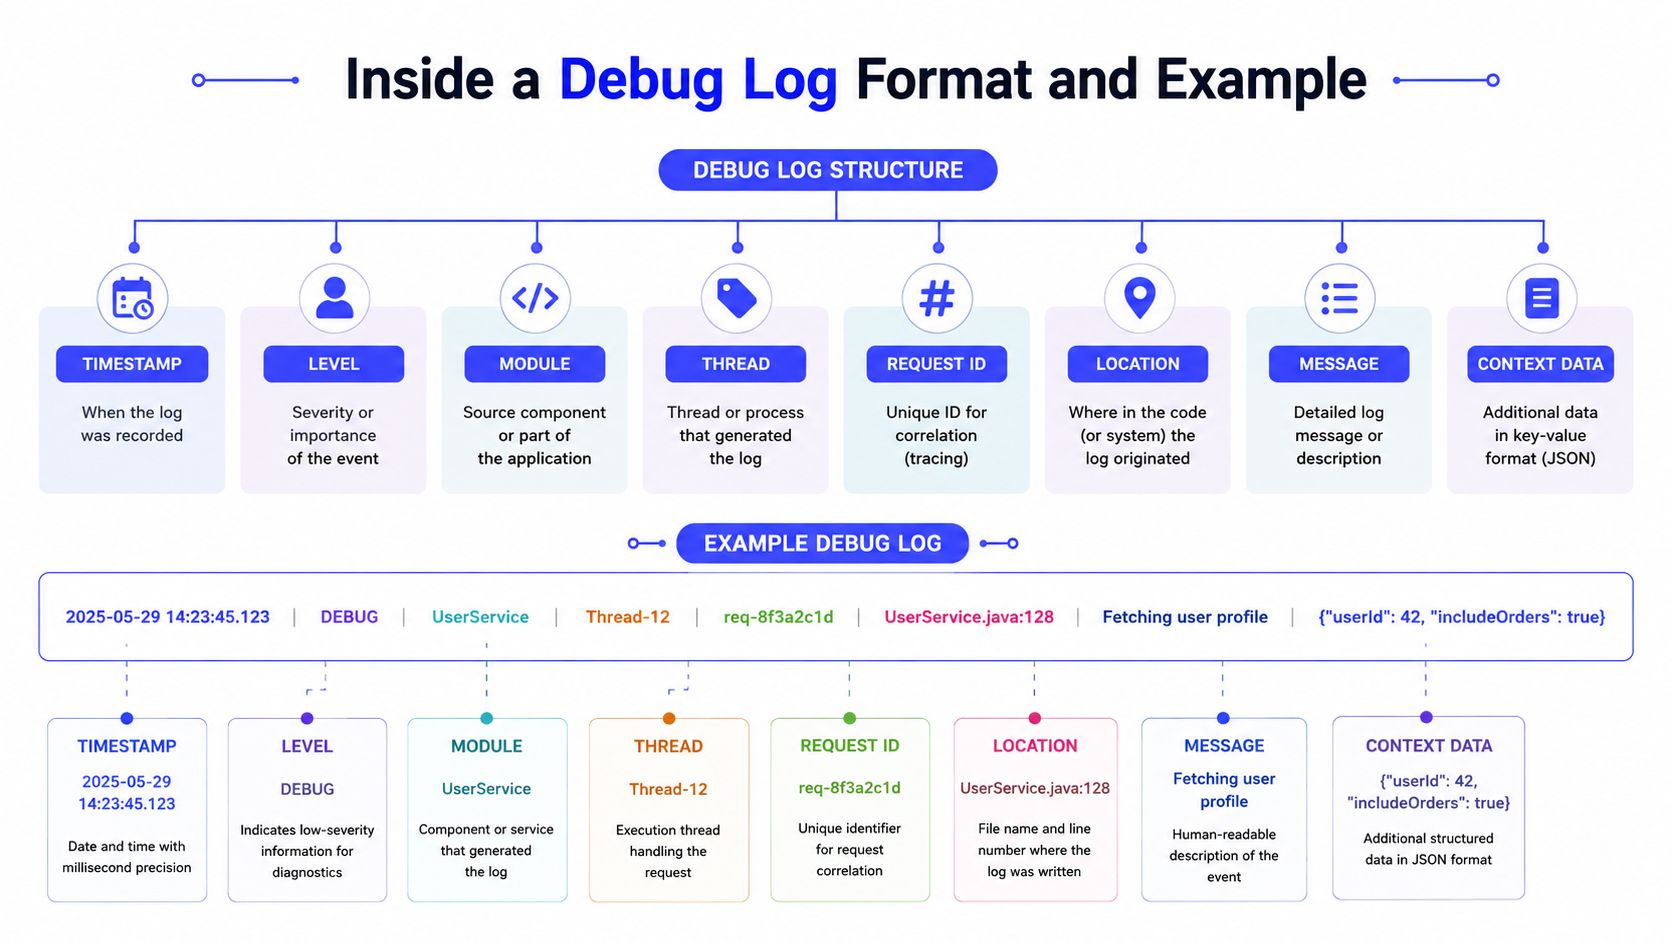
A debug record becomes useful when engineers can search it, connect it to related events, and interpret it without reading an entire text file. Structured fields provide that context.
A practical record commonly includes a timestamp, correlation ID, log level, service or component name, event message, relevant state, and duration. The exact schema varies by application, but the design goal is consistent: preserve the path of one operation across multiple functions and services.
Reading a service event
A representative structured event might look like this:
{"timestamp":"2026-09-18T02:14:08Z","level":"DEBUG","service":"checkout-api","correlation_id":"req-7f2","event":"payment_route_selected","provider":"primary","cart_items":3,"duration_ms":18}
The useful questions are:
- Which request:
correlation_idconnects this event to other records. - Where it happened:
serviceidentifies the component. - What happened:
eventgives the diagnostic action. - What state mattered:
providerandcart_itemsdescribe safe, relevant context. - How long it took:
duration_mshelps identify latency in the path.
The record doesn't need to contain a card number, password, session token, or raw customer address. Those fields add risk without improving the routing diagnosis.
For broader guidance on handling failures in an Express service, see this Express error handling guide.
Reading an AI inference event
An inference path might produce a sequence like:
{"level":"DEBUG","component":"retriever","correlation_id":"req-91a","event":"filter_applied","tenant_scope":"masked","filters":["region","product"],"candidate_count":"redacted"}
{"level":"DEBUG","component":"prompt_builder","correlation_id":"req-91a","event":"context assembled","document_ids":["doc-a","doc-b"],"template_version":"support-v3"}
{"level":"DEBUG","component":"validator","correlation_id":"req-91a","event":"citation_check","branch":"fallback","reason":"missing_source_reference"}
These records let an engineer reconstruct the execution path and isolate the state transition that changed the outcome. High-granularity records are valuable because they expose code paths, timings, internal state, and external interactions, as explained in this debug logging glossary.
The strongest schemas record diagnostic intent, not indiscriminate payloads. Log that a filter was applied, which branch ran, and which version was active. Store only the input detail required to investigate, and mask the rest at the source.
"Real World Examples of Debug Logs in AI Systems"
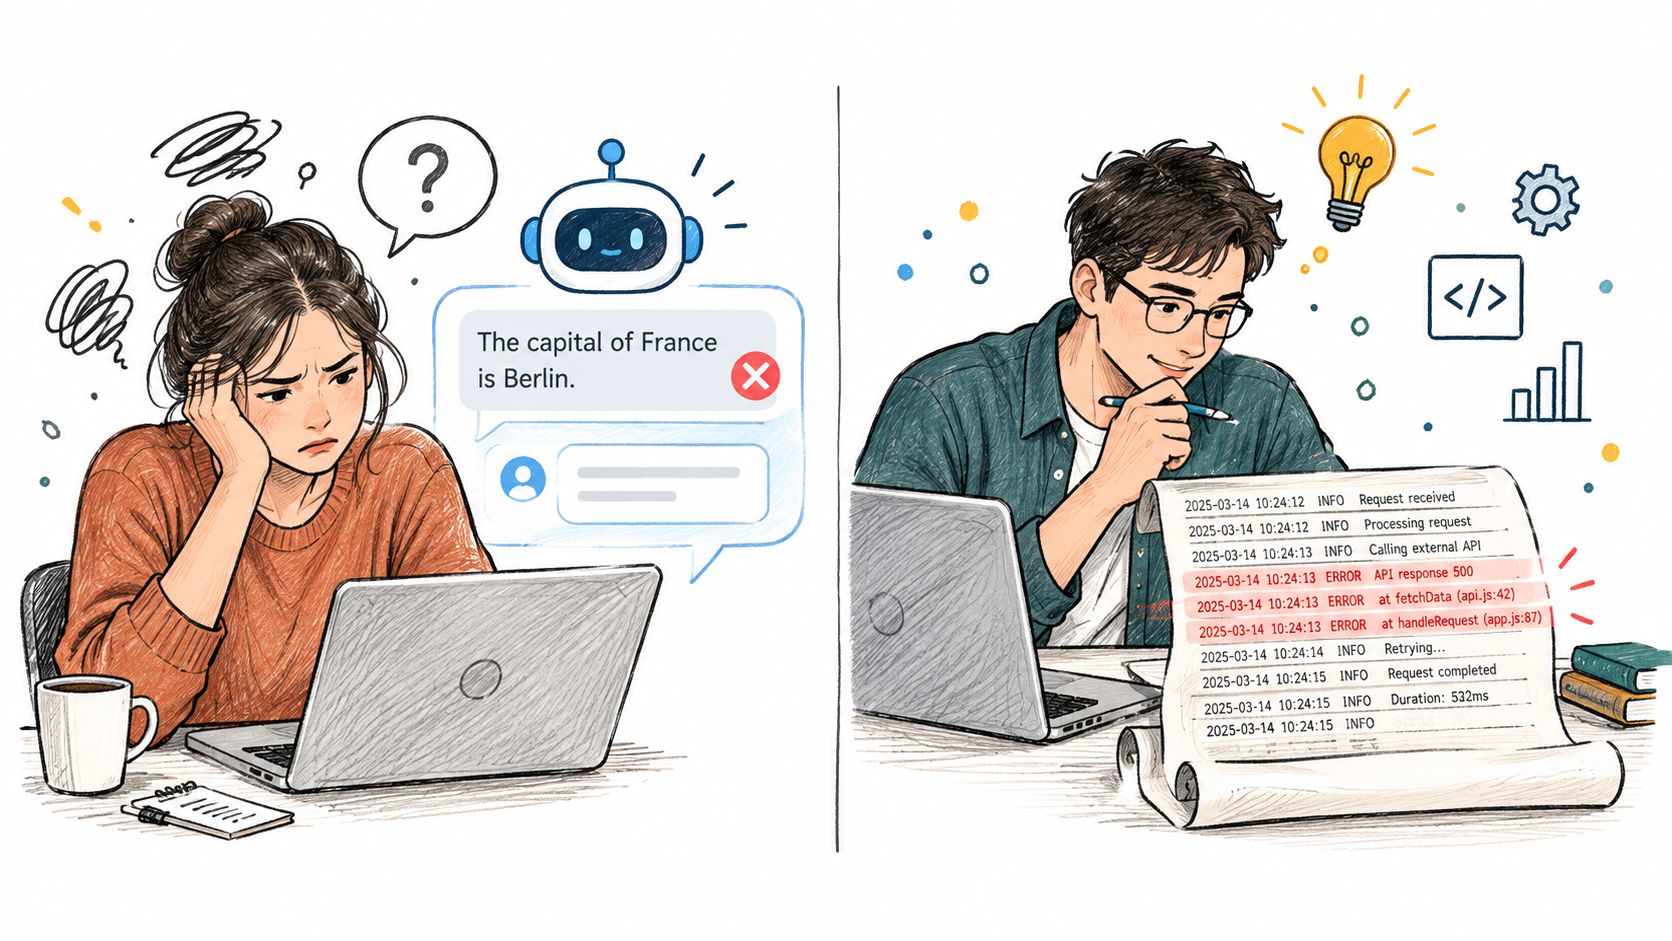
AI incidents often look like quality problems until you inspect the execution path. A wrong answer may come from retrieval, prompt assembly, a model response, a policy filter, or a post-processing step. Debug logging helps separate those possibilities.
Example one with a support copilot
A customer support team notices that its copilot gives inconsistent return-policy answers. The normal logs show successful retrieval and a successful model response, so the product dashboard reports healthy requests.
The team forms a narrow hypothesis: a retrieval branch applies a region filter before ranking, but the filter is using the request locale rather than the customer account region. Engineers enable DEBUG only for the affected route and capture the correlation ID, filter selection, candidate document identifiers, ranking branch, prompt template version, and validator result.
The records show that the expected regional policy document was excluded before ranking. The model answered fluently from a general policy document, which explains why no application error appeared. The team fixes the filter and keeps the debug setting scoped to the route until validation confirms the corrected path.
The business impact isn't just a cleaner log. The evidence separates a retrieval defect from a model-quality problem, limits unnecessary prompt or model changes, and gives the product owner a defensible explanation for the incorrect answer.
A useful investigation sequence is:
- Compare the request context with the filter context.
- Confirm which retrieval branch ran.
- Inspect selected document identifiers, not sensitive document contents.
- Verify the prompt template version.
- Confirm the citation or policy validator's decision.
- Disable DEBUG after the test.
Example two with a training pipeline
A model training job begins producing unstable evaluation results. The job completes, and the scheduler reports success. The team suspects silent data drift in a feature transformation step.
Engineers enable targeted DEBUG around ingestion, feature transformation, schema validation, and dataset handoff. They record transformation names, validation outcomes, batch identifiers, timing fields, and safe summaries of feature distributions. They avoid writing raw customer records or sensitive feature values.
The debug trail shows that one transformation took an unexpected fallback path after a schema mismatch. The pipeline continued with a different representation, so the failure appeared as a quality issue rather than a hard job error. The team corrects the schema contract, adds an explicit validation failure, and keeps the detailed records only for the investigation period.
The lesson for a CTO is direct: debug logs can protect delivery quality when they expose the decision that changed the data, not when they dump every row into a logging system.
For a visual explanation of how application debugging can support incident analysis, the following video provides additional context:
"Best Practices for Logging Retention and Safe Troubleshooting"
Verbose logging creates a clear trade-off. More detail can improve post-incident forensics, but continuous collection can increase latency, storage and retention burden, and CPU utilization. Research on a kernel-level debugging interface measured throughput reductions between 0.4% and 6.4% and CPU utilization increases between 0.4% and 10% in the referenced technical study.
That doesn't mean DEBUG is unsafe. It means you should treat it like a controlled diagnostic intervention.
Use the enable, scope, redact, rotate framework
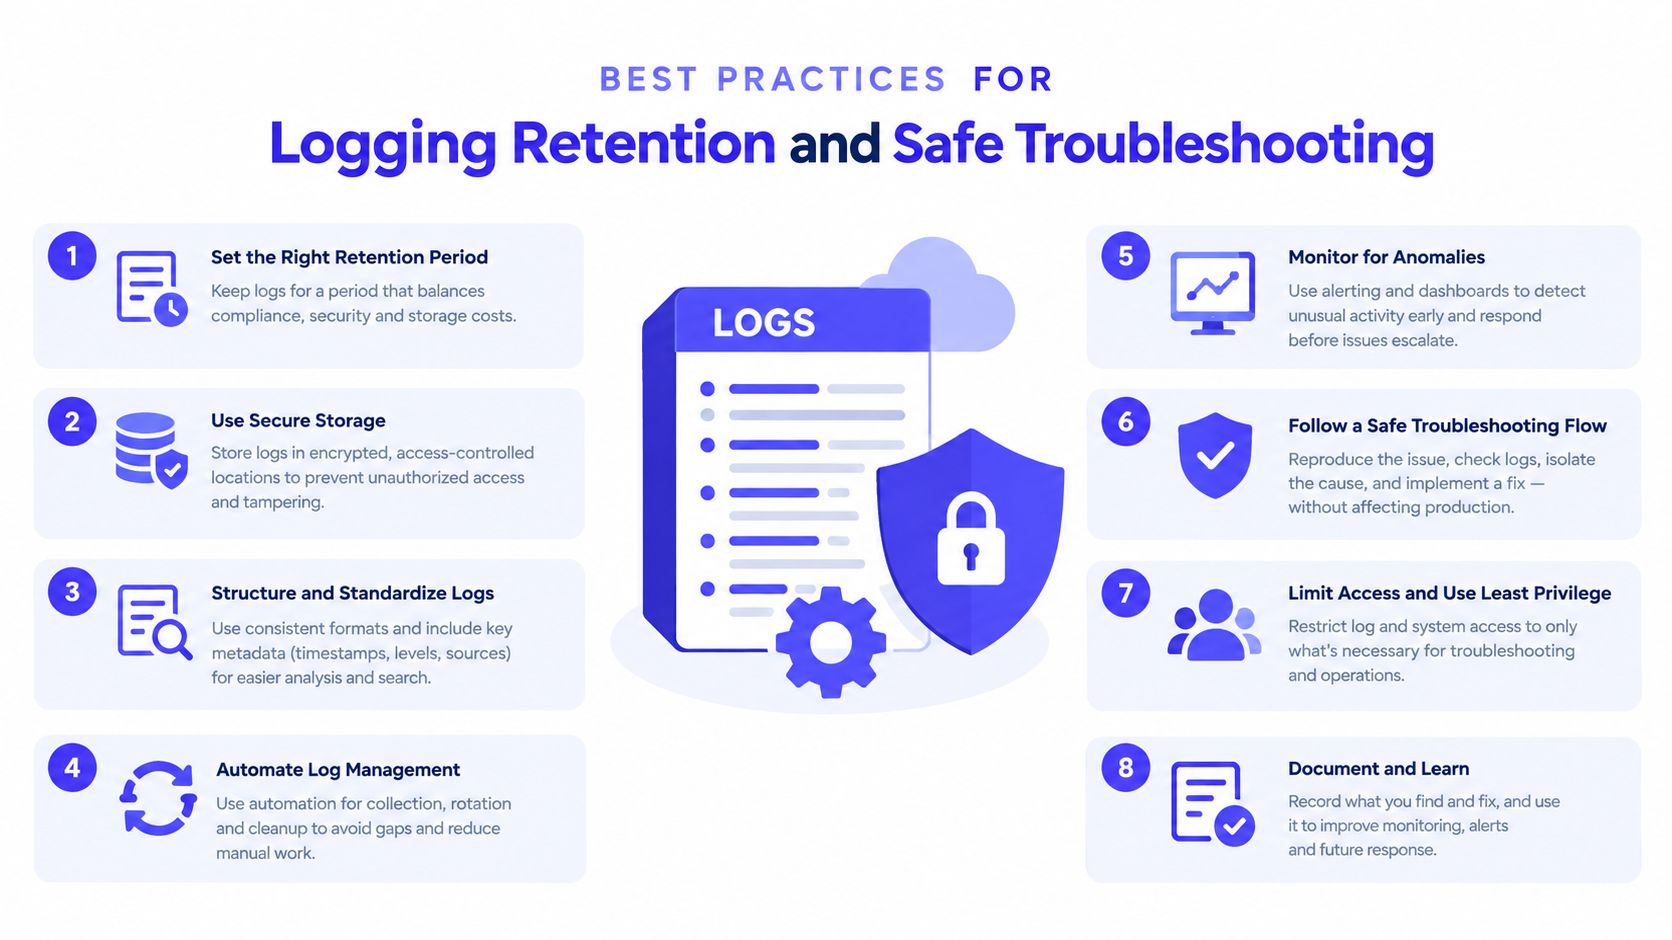
Enable only for a defined question. Write down the failure, suspected component, required fields, owner, start condition, and stop condition. If the team can't state what evidence it needs, DEBUG will produce noise rather than insight.
Scope the collection. Prefer one service, subsystem, tenant-safe test path, request identifier, or controlled environment. A targeted debug session is easier to search and less likely to affect unrelated workloads.
Write asynchronously where practical. Diagnostic output shouldn't block the critical request path unnecessarily. Use structured records and make sure the logging pipeline can handle the temporary volume.
Redact at the source. Never print passwords, credentials, session tokens, API keys, or raw sensitive personal data. OWASP guidance recommends recording security-relevant events while excluding or masking sensitive values, and it supports secure logging practices from the OpenSSF guide.
Correlate safely. Use request identifiers and component names to connect events. Don't use a customer email address or access token as the correlation key.
Centralize and protect. Forward records to a central platform, normalize them, restrict access, and protect them against tampering. Logs may become evidence during an incident, so operators need confidence that the records haven't been altered.
Rotate and retain deliberately. Debug data should have an explicit retention rule. Some environments use debug retention windows as short as 7–14 days, according to guidance on logging without personally identifiable information. Your policy should reflect regulatory, contractual, and investigative needs rather than an arbitrary default.
Disable after collection. The incident owner should confirm that the setting is off, the scope has returned to normal, and temporary exports or local copies have been removed or protected.
Logs are production data. Apply the same care to debug records that you apply to customer-facing databases and operational backups.
Keep the session useful during an incident
An on-call engineer should capture the change itself. Record when DEBUG was enabled, which configuration changed, which services were affected, who approved it, and when the team restored the previous level.
Add the session details to your incident response process. This makes debugging repeatable and helps security, compliance, and engineering teams understand how sensitive records entered the system.
"Putting Debug Logs to Work in Your Team"
Debug logging works best when your team treats it as a small operational process. The developer who adds a field may understand the code, but the platform or MLOps owner usually needs to define collection, access, retention, and rollback standards.
A reusable debug session template
- Incident or investigation: State the user-visible symptom.
- Hypothesis: Name the component and decision you suspect.
- Scope: Specify service, route, subsystem, environment, or correlation filter.
- Fields: List the variables, branches, timings, and external statuses required.
- Exclusions: List secrets, credentials, tokens, and personal data that must not appear.
- Owner: Assign one person to enable, monitor, and disable the session.
- Retention: Set the deletion or restricted-access date before collection begins.
- Exit test: Define the evidence needed to close the investigation.
Teams evaluating broader instrumentation can also review AI observability platforms alongside their existing logging, tracing, metrics, and evaluation workflows.
Start with three actions:
- Inventory your production services and identify where DEBUG can be enabled safely.
- Add correlation IDs, structured fields, source-level redaction, and an explicit disable procedure.
- Run a controlled investigation, review the records for sensitive data and overhead, then update the team standard.
For teams that need additional capability, ThirstySprout connects companies with remote senior AI engineers, MLOps specialists, and data engineers who can design observability workflows around existing systems and delivery goals.
ThirstySprout can help you staff a focused AI observability or MLOps pilot with vetted remote engineers who understand logging, tracing, model operations, and production incident workflows. Visit ThirstySprout to start a pilot or review sample profiles for the skills your team needs.
Hire from the Top 1% Talent Network
Ready to accelerate your hiring or scale your company with our top-tier technical talent? Let's chat.