
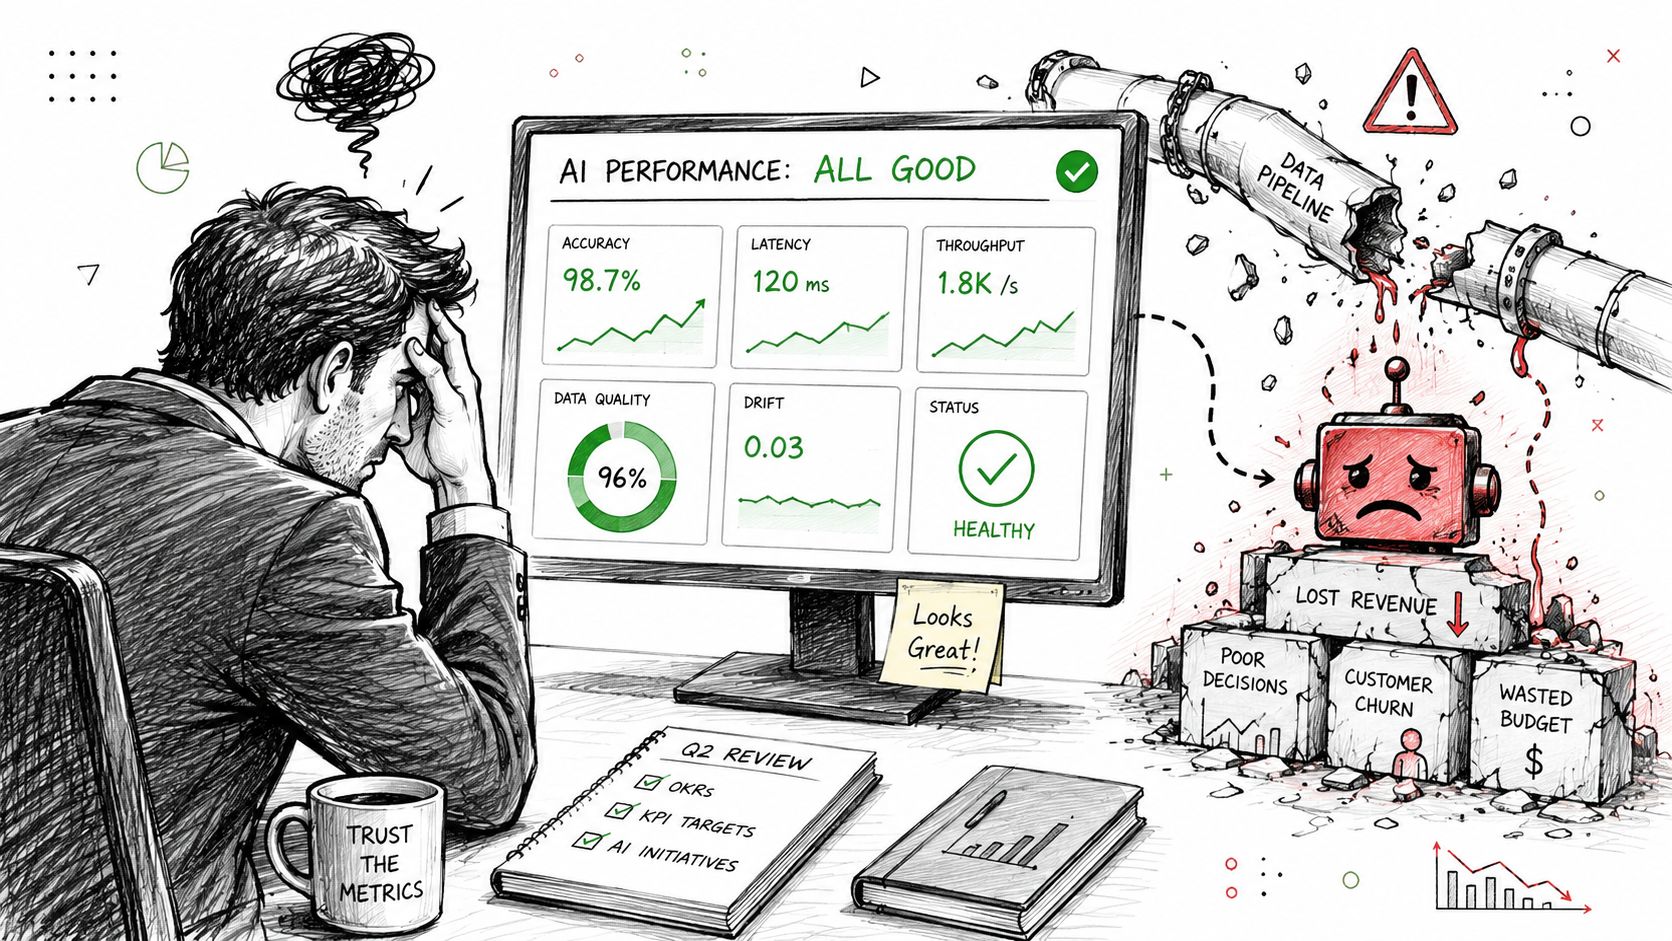
Your AI feature shipped. Requests are returning. The API dashboard is green. Customers are still unhappy.
That's the moment it becomes clear that traditional monitoring doesn't describe AI failure. It tells you whether the system is up. It doesn't tell you whether the model is still making good decisions, whether prompt changes degraded outputs, or whether a quiet shift in upstream data is poisoning results.
If you're a CTO planning a first rollout, treat AI observability as part of production reliability, not as an optional analytics add-on. The right platform helps you catch silent degradation, connect model behavior to business impact, and give engineering a way to debug systems that don't fail like normal software.
TL;DR
- AI observability platforms exist because AI systems often fail silently. A service can stay healthy while output quality drops.
- The strongest platforms combine model performance, data quality, and inference monitoring in one operating view, as described by New Relic's guide to AI observability.
- Start with traces first. Production traces create the context you need for evaluation, debugging, and regression detection.
- Vendor choice is mostly about trade-offs. Fast setup, deep visibility, infrastructure overhead, engineering effort, and compliance rarely come together in one perfect tool.
- Team design matters as much as tooling. Without people who can interpret telemetry and tie it to product outcomes, the platform becomes another dashboard no one trusts.
Why Your AI Is Failing Silently
The usual failure mode isn't a crash. It's a wrong answer that looks operationally healthy.
A recommendation model can return a result in time and still push irrelevant products. A fraud model can keep scoring transactions and still miss a new pattern. An LLM workflow can complete every step and still hallucinate something costly. Your application performance monitoring tool will usually report success because, from an infrastructure point of view, the request finished.
That gap is why AI observability matters. Monitoring asks, “Is the service running?” Observability asks, “Why did this system produce that output, and what changed?”
Traditional dashboards stop too early
Classic APM tools such as Datadog, Grafana, Kibana, and New Relic are still necessary. They tell you about latency, throughput, errors, and infrastructure health. But AI systems add another layer of uncertainty. Outputs are probabilistic. Inputs drift. Prompt chains break in ways that still return a valid HTTP response.
That's especially dangerous in regulated or customer-facing workflows. If you work in lending, underwriting, support automation, or healthcare operations, output quality isn't a “nice to have.” It's part of operational risk. For a useful policy lens, see Visbanking analysis of AI bias, which highlights why silent model behavior matters beyond engineering.
AI observability becomes necessary the moment a model can be “available” and still be wrong.
Why this category is moving fast
The market is growing because teams have moved from AI experiments to production systems that need reliability. The AI observability market report from Market.us projects growth from USD 1.4 Billion in 2023 to USD 10.7 Billion by 2033, with a 22.5% CAGR, and says North America held 37.4% of the market in 2023, valued at USD 0.52 Billion.
That's not just vendor hype. It reflects a practical shift inside engineering orgs. Once AI influences revenue, support quality, risk controls, or internal automation, observability stops being optional.
A quick test for CTOs
If any of these are true, you already need AI observability:
- Your team uses LLMs in production and can't explain why answers changed after a deployment.
- Your models depend on live data and no one is watching schema violations, drift, or missing features.
- Your engineers debug by reading raw logs and replaying requests manually.
- Your incident process treats model quality and infrastructure health as separate worlds.
That setup works in staging. It breaks in production.
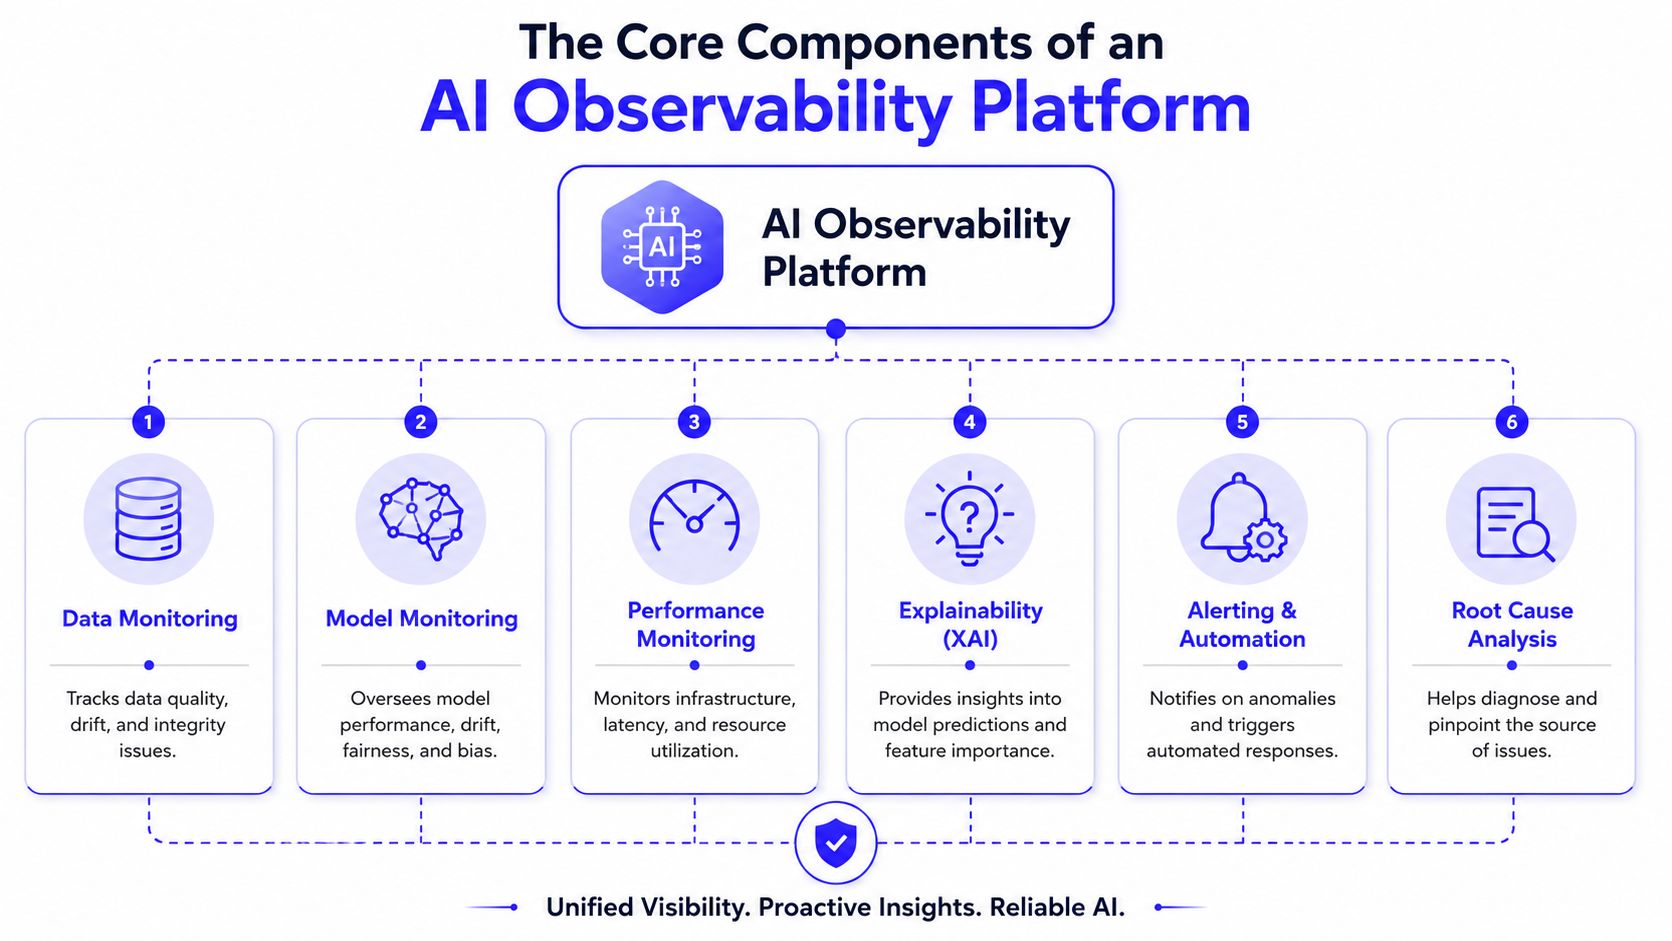
The Core Components of an AI Observability Platform
A useful AI observability platform answers one question fast: why did the model behave this way on this request, in this version of the system, with these inputs?
That standard is higher than ordinary application monitoring. A healthy API can still return low-quality outputs, drifted recommendations, or unsafe answers. The platform has to connect model behavior, data condition, and serving health in the same investigation path.
The three pillars you actually need
Start with three capabilities.
- Model performance monitoring shows whether outputs remain useful over time. For classical ML, that usually means task metrics, threshold behavior, and segment-level degradation. For LLM systems, it often means response quality signals, hallucination patterns, tool success rates, and changes after prompt or model updates.
- Data quality tracking catches input problems before teams blame the model. Watch for schema violations, null spikes, feature drift, missing context, and values that fall outside expected ranges.
- Inference monitoring covers the runtime path. Track request latency, error rates, throughput, timeout patterns, token use, resource pressure, and failures in retrieval or tool execution.
These pillars matter because the same symptom can come from very different causes. Lower answer quality after a release might trace back to a prompt edit, a retrieval outage, a broken feature pipeline, or a model version change. If the platform cannot correlate those signals, incident response slows down and ownership gets messy.
How the components work together in production
Vendors often present these capabilities as separate screens. That is convenient for product packaging and inconvenient for operators.
In production, engineers need one path from symptom to cause. If a support copilot starts producing weaker answers after a backend integration change, the team should be able to inspect output quality, request traces, retrieved context, prompt version, model version, and upstream field availability without stitching five tools together by hand.
| Signal | What it tells you | Example issue |
|---|---|---|
| Model performance | Is output quality changing | Lower relevance after prompt edits |
| Data quality | Did inputs change unexpectedly | Missing customer fields in context |
| Inference health | Is the runtime path unstable | Timeout spikes during retrieval |
Teams that still split AI telemetry from the rest of observability usually pay for it during incident review. Logs sit in one place, traces in another, offline evaluations in a notebook, and no one can prove what changed first. If your team is already comparing visualization and workflow trade-offs across monitoring tools, this breakdown of Kibana vs Grafana for observability workflows is a useful reference.
Components that separate decent tools from strong ones
The better platforms add a few layers that matter once the first real incident hits.
Explainability and trace context
A quality score drop is only a starting point. Engineers need the surrounding evidence.
For classical ML, that may include feature contribution, cohort comparisons, and threshold behavior. For LLM applications, the useful unit of analysis is usually the full request trace: prompt template, retrieved documents, conversation state, tool calls, guardrail results, final output, and user feedback if you collect it. Without that context, teams can detect problems but still struggle to fix them.
Alerting tied to action
Alerts should narrow the search space. “Latency increased” is weak because it leaves the responder to guess where to look. “Latency increased on retrieval-heavy requests after prompt version 12, and token usage rose at the same time” gives the on-call engineer a place to start.
Good alerting also requires restraint. If every drift signal pages the team, they will mute the system. In early rollouts, I usually recommend routing lower-confidence model quality alerts to Slack or a review queue first, then promoting only proven indicators into paging.
Practical rule: If an alert does not suggest an owner, a likely cause, or the first diagnostic step, it is still raw telemetry.
Root-cause workflow and change tracking
Observability earns its budget during root-cause analysis. The platform should let an engineer move from a bad output to the likely trigger quickly: a deployment, prompt edit, model swap, feature pipeline issue, retrieval change, or third-party dependency failure.
Change tracking is the part teams often miss on the first rollout. If the platform cannot line up behavioral shifts with system changes, every investigation becomes a debate between application, platform, and data teams.
A practical example
An e-commerce team updates ranking inputs before a major promotion. Infrastructure dashboards look normal, but conversion quality starts slipping.
A useful AI observability platform should narrow that problem quickly. It should show whether recommendation features arrived with missing fields, whether the input distribution shifted enough to affect ranking behavior, or whether the model started behaving differently for a specific traffic segment after the release.
Without that visibility, teams burn hours in the wrong order. They inspect the model first, then the API, then caching, then serving capacity, while the business impact continues.
Your AI Observability Platform Evaluation Scorecard
Most vendor evaluations fail because teams buy the demo. They don't buy the operating reality.
A useful scorecard forces you to assess implementation effort, fit with your stack, and long-term cost before procurement momentum takes over. The goal isn't to find a perfect platform. It's to avoid one that creates blind spots or drags your team into expensive rework.
Use this scorecard in your proof of concept
Score each vendor during a live proof of concept, not from the sales deck alone.
| Criterion | Description | Weight (1-5) | Vendor A Score | Vendor B Score |
|---|---|---|---|---|
| Instrumentation approach | SDK, proxy, agent, or hybrid. How intrusive is setup and how much control do you keep? | 5 | ||
| Trace depth | Can you inspect prompts, tool calls, model outputs, metadata, and downstream dependencies in one path? | 5 | ||
| Correlation across systems | Does it connect AI telemetry with logs, metrics, traces, and app infrastructure? | 5 | ||
| Data quality visibility | Can the platform detect schema issues, missing features, and input drift clearly? | 4 | ||
| Evaluation workflow | Can you build regression checks from production examples and schedule them reliably? | 4 | ||
| Alert usability | Are alerts actionable, low-noise, and tied to owners or runbooks? | 4 | ||
| Security and deployment fit | Does it match your compliance posture, hosting needs, and data handling constraints? | 5 | ||
| Developer workflow | Will engineers and data scientists actually use it during incidents and releases? | 4 | ||
| Cost transparency | Can your team estimate telemetry, storage, latency, and implementation overhead early? | 5 | ||
| Exit risk | How hard would it be to migrate later if the platform underdelivers? | 3 |
What a strong answer looks like
A credible vendor should be able to answer these questions directly:
- Implementation reality. What exactly has to be instrumented? Which services need SDK changes? Which routes can be observed without code changes?
- Debugging depth. Can an engineer move from an end-user complaint to the trace, model call, retrieved context, and downstream system impact in one workflow?
- Operational ownership. Who uses the tool during an incident? Platform engineering, MLOps, backend, or data science?
- Security posture. What data leaves your environment, what can be redacted, and what can stay self-hosted or within a controlled boundary?
- Cost model. How does pricing change when request volume, trace depth, or retention needs increase?
Red flags during vendor review
Some warning signs show up fast.
- A polished demo with shallow instrumentation details. If the team can't explain how traces are captured, expect surprises later.
- AI metrics in a silo. If the platform can't connect model behavior to the rest of your stack, root-cause analysis gets slow.
- Weak support for version context. You need to know which model, prompt, dataset, and deployment version produced a bad output.
- No honest answer on trade-offs. Every platform has one. Good vendors admit it.
Ask vendors to debug a realistic broken scenario, not to present a healthy dashboard.
Two quick mini-cases
Case one. A startup shipping its first support copilot should usually favor fast implementation and trace visibility over deep customization. Time-to-first-signal matters more than elegant architecture.
Case two. A larger fintech team should usually bias toward stronger governance, data controls, and reproducible evaluation workflows. Their risk profile is different, and “easy setup” won't matter if the tool can't support auditability.
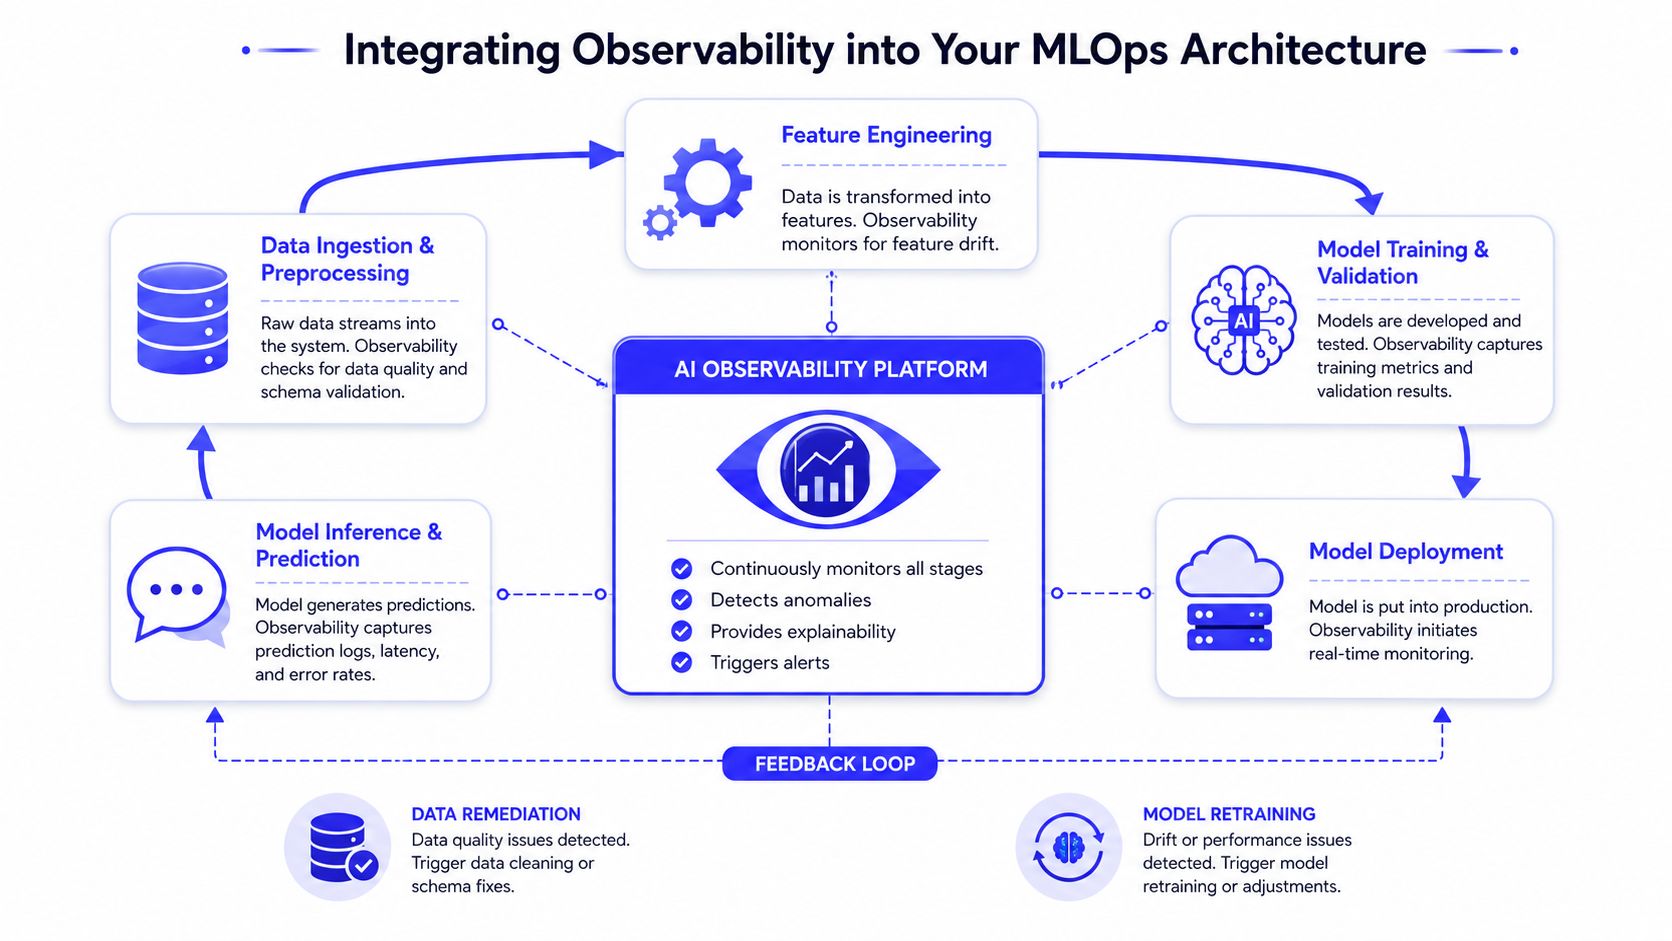
Integrating Observability into Your MLOps Architecture
The fastest way to fail is to bolt observability on after production issues begin. The signal quality will be poor, the ownership will be fuzzy, and engineers will treat the tool as optional.
Good integration starts in the delivery pipeline.
Start with traces, not dashboards
The most effective implementations unify logs, metrics, traces, and AI-specific telemetry so teams can do end-to-end correlation and diagnose latency spikes, hallucinations, and regression cascades quickly, as described in Coralogix's guide to AI observability tooling.
That's the architectural principle. The practical starting point is even simpler. Capture traces first.
A trace should answer these questions for every important request:
- What input arrived
- Which prompt or model version ran
- Which tools or retrieval steps executed
- What output was produced
- What downstream systems were touched
- How long each step took
For teams building a broader operating model around AI delivery, this guide to DevOps for machine learning is a good architectural reference.
A rollout pattern that works
A phased implementation is generally advisable.
Phase one
Instrument the inference path for one production workflow. Don't start with every model. Pick the one that already affects revenue, support quality, or risk.
Phase two
Attach version metadata. Every trace should include model version, prompt version, retrieval configuration, and release identifier.
Phase three
Layer in evaluation and alerting from observed production behavior. Observability then starts providing operational advantage instead of passive logging.
A short walkthrough can help teams visualize the architecture before they implement it.
Example architecture hook points
Here's the minimum instrumentation map:
| MLOps stage | What to capture |
|---|---|
| Data ingestion | Schema checks, missing values, lineage metadata |
| Feature engineering | Feature distributions, transformation failures |
| Training and validation | Training metrics, validation outputs, version metadata |
| Deployment | Release identifiers, rollback context |
| Inference | Request traces, latency, outputs, tool calls, errors |
If you can't connect a bad answer to the exact trace that produced it, you don't have observability yet. You have logging.
Vendor Landscape and Real-World Use Cases
The market is crowded because different teams have different failure modes. A startup with one support copilot doesn't need the same tool shape as an enterprise running multiple ML and LLM services across regulated workflows.
A better way to evaluate vendors is by category, not by logo count.
Pure-play AI observability vendors
Platforms such as Arize AI and WhyLabs are built around model and data behavior first. They're often a strong fit when your biggest risk is drift, evaluation quality, or model-specific diagnosis rather than broad infrastructure correlation.
A fintech example fits here. Suppose a fraud model keeps serving predictions, but the team suspects behavior is changing with new transaction patterns. A pure-play platform usually gives data scientists and MLOps engineers a cleaner workflow for inspecting input quality, model behavior, and evaluation drift.
These tools are often strongest when the AI system itself is the main object of investigation.
Full-stack observability vendors with AI support
Platforms such as New Relic, Datadog, and Coralogix are stronger when you need AI telemetry tied directly to application and infrastructure behavior.
An e-commerce team running an LLM assistant alongside retrieval, pricing APIs, and customer profile services often benefits from this model. If answer quality degrades only when backend latency rises, a unified platform helps engineers correlate the AI symptom with the broader system cause faster.
This category is often better for platform engineering teams that want one operational workflow across AI and non-AI services.
Evaluation-first and tracing-first tools
Tools such as Braintrust, Langfuse, and LangSmith are especially useful when your immediate pain is tracing model behavior, building evals, and catching regressions before users feel them.
Braintrust's implementation guidance is particularly practical. It recommends starting with trace capture and then building regression detection from production-derived examples. It also notes that datasets with as few as 10 to 200 examples can catch regressions when paired with structured scorers and scheduled monitors, according to Braintrust's explanation of AI observability.
That matters for lean teams. You don't need a huge labeling program to start. You need representative traces and a repeatable scoring method.
A simple matching guide
- Choose pure-play AI monitoring if your biggest questions are about model quality, drift, and evaluation.
- Choose a full-stack platform if incidents usually cross service boundaries and your AI doesn't live in isolation.
- Choose tracing and eval-centric tooling if you're early in the lifecycle and need fast debugging plus regression control.
No category wins universally. The best fit depends on whether your team is mostly debugging models, systems, or multi-step AI workflows that mix both.
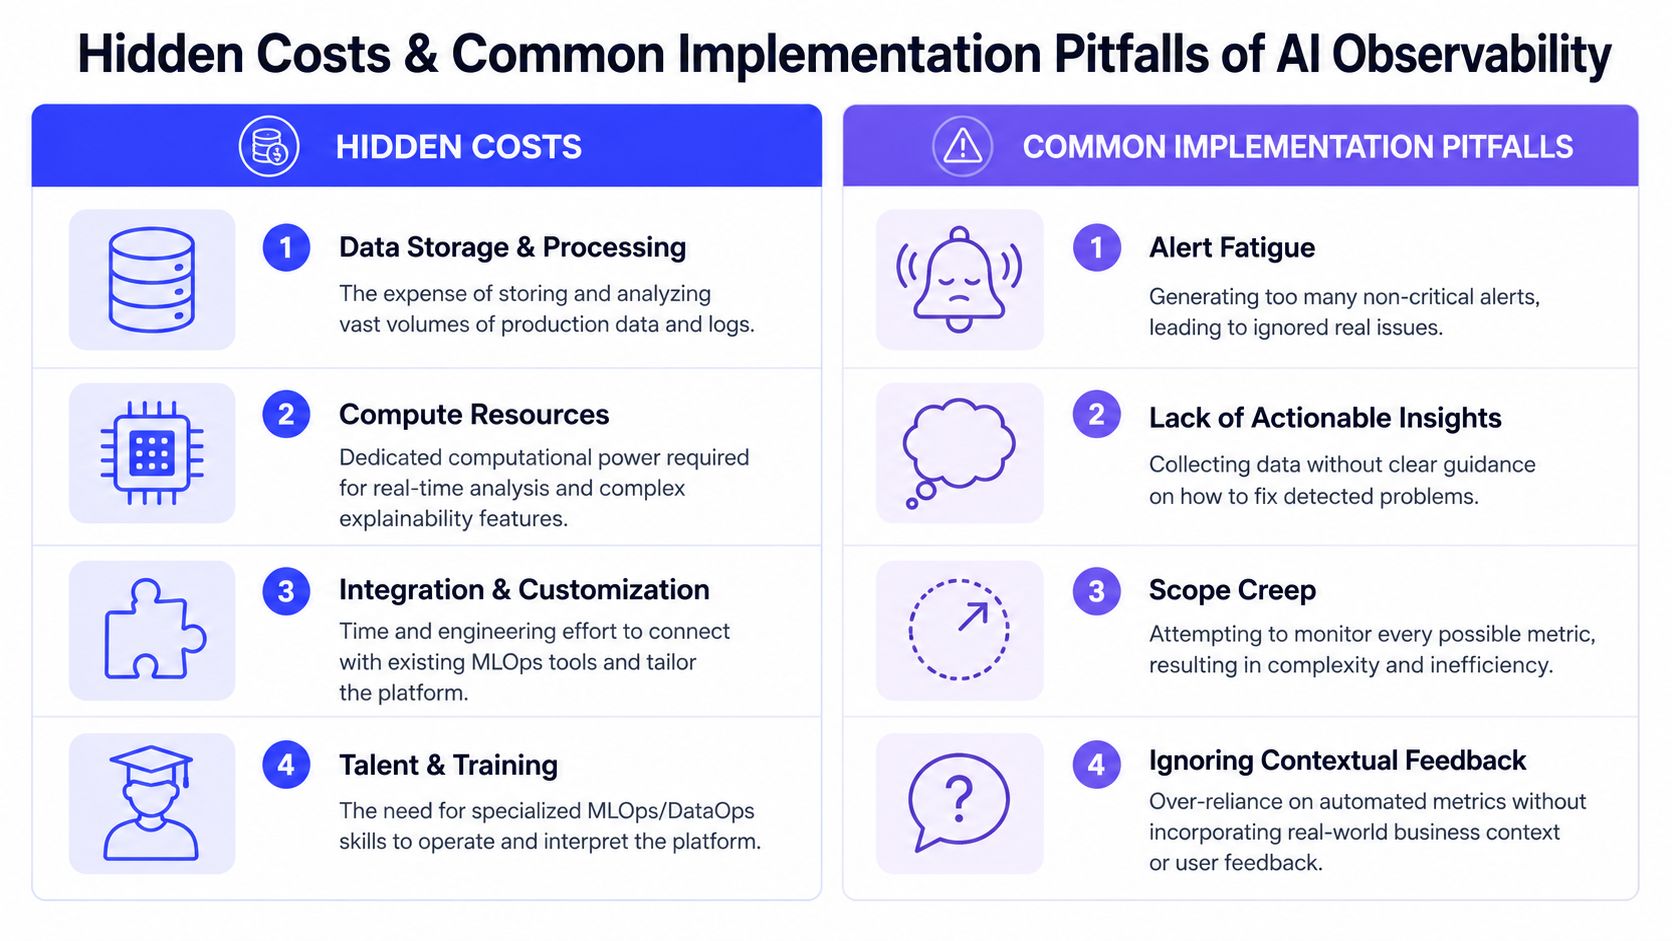
The Hidden Costs and Common Implementation Pitfalls
Observability cost is often underestimated because teams primarily compare subscription pricing. The complete bill shows up in latency overhead, cloud spend, storage growth, and engineering time.
Here, architecture choices matter more than brand preference.
The proxy versus SDK trade-off
The easiest pitch in the market is “zero instrumentation.” That usually means a proxy-based approach. It gets telemetry quickly, which is attractive for lean teams.
But there's a cost. According to Arize AI's analysis of observability trade-offs, proxy-based observability tools can add 200–400ms of latency per request and raise cloud compute costs by 30–50%, while SDK-based tools reduce that overhead but may require 2–3x more engineering time to implement. The same source says 68% of teams delay adoption because they can't forecast that trade-off clearly.
That's one of the few concrete numbers in this category that helps CTOs make a decision.
Here's the practical reading:
| Approach | Strength | Cost |
|---|---|---|
| Proxy-based | Fast deployment, low initial code change | Higher latency and infrastructure overhead |
| SDK-based | Better performance profile and deeper control | More engineering time up front |
If you're standardizing your broader operating model, these MLOps best practices for production systems help frame observability as part of platform design, not as an isolated purchase.
Common implementation mistakes
Tooling isn't the main reason rollouts fail. Operating habits are.
Alert fatigue
Teams often alert on every anomaly they can detect. That creates noise fast. When everything looks urgent, engineers ignore the channel.
Vanity metrics
A dashboard full of tokens, invocations, and latency percentiles can still be useless if none of it maps to user harm or operator action.
No feedback loop
Some teams detect problems but never route them into prompt fixes, data remediation, retraining, or release controls. That turns observability into expensive evidence collection.
The platform should shorten the path from “something looks off” to “here's the change we need to make.”
Two implementation rules that save pain
- Start narrow. Instrument one high-value workflow first. Learn what telemetry is actionable before expanding coverage.
- Tie every alert to a runbook. If no one knows what to do with a signal, don't page on it.
A good rollout feels boring after a while. That's the point. Engineering trusts the signals, and incidents become easier to localize.
Hiring and Skills for Production AI Observability
A platform won't fix an observability gap if the team still thinks in dashboards instead of diagnosis.
Running production AI observability well requires a mix of MLOps, backend, and data thinking. You need people who can inspect a trace, understand why the model behaved that way, and connect technical symptoms to business impact.
The skills that matter most
The strongest operators usually share these capabilities:
- Telemetry judgment. They know which signals are actionable and which are just noise.
- Root-cause discipline. They can move across model behavior, data quality, inference health, and infrastructure context without getting lost.
- Evaluation mindset. They think in regressions, baselines, and production examples, not just offline benchmark scores.
- System design fluency. They understand how model serving, feature pipelines, retrieval systems, APIs, and release workflows interact.
- Business translation. They can explain why a latency spike or output drift matters to support quality, risk exposure, or conversion.
Interview questions that expose real skill
Use scenario questions. They reveal more than tool trivia.
- A model's outputs got worse, but latency and error rates stayed normal. How would you investigate?
- What metadata would you attach to an inference trace so an engineer can debug a bad answer quickly?
- How would you decide whether to use proxy instrumentation or SDK instrumentation for a first rollout?
- A drift alert fired. What would make you trust it, and what would make you ignore it?
- How would you build a small regression dataset from production behavior for an LLM workflow?
- Which alerts belong in PagerDuty, and which should stay in a dashboard or Slack channel?
Good candidates answer with process, not buzzwords.
Team shape for a first rollout
You don't always need a dedicated observability specialist on day one. A practical first setup usually combines:
- One MLOps or platform engineer who owns instrumentation and telemetry flow
- One ML or applied AI engineer who understands model behavior and evaluation
- One engineering manager or tech lead who ties signals to operating priorities
Hire for people who can explain why the model failed, not just people who can install the vendor SDK.
If your current team can't cover those skills, bring in operators who've done production rollouts before. The tool decision is important. The people running it matter more.
If you're building AI products and need engineers who've already shipped MLOps, LLM, and observability systems in production, ThirstySprout can help you assemble that team quickly. You can Start a Pilot or See Sample Profiles to find senior AI and MLOps talent that can instrument the stack, evaluate vendors, and make your first observability rollout work operationally.
Hire from the Top 1% Talent Network
Ready to accelerate your hiring or scale your company with our top-tier technical talent? Let's chat.