
You’re probably making this decision under pressure.
Your AI product is growing. Inference traffic is getting less predictable. The team wants better dashboards, cleaner alerts, and fewer blind spots during incidents. At the same time, you don’t want to lock the company into an observability front end that becomes expensive to maintain or painful to replace a year from now.
That’s why kibana vs grafana isn’t a cosmetic tooling debate. It’s a platform decision. It affects how your engineers debug failures, how fast they can onboard, how much duplicated telemetry plumbing you build, and how hard a future migration will hurt.
Your Guide to Choosing Between Kibana and Grafana
A CTO usually reaches this decision at the same moment observability starts getting expensive.
Your team is shipping new model versions, inference traffic is climbing, incidents are harder to explain, and every extra dashboard or query language creates operational drag. The right choice is the one your engineers can run, extend, and replace without turning observability into its own platform tax.
Here is the short answer.
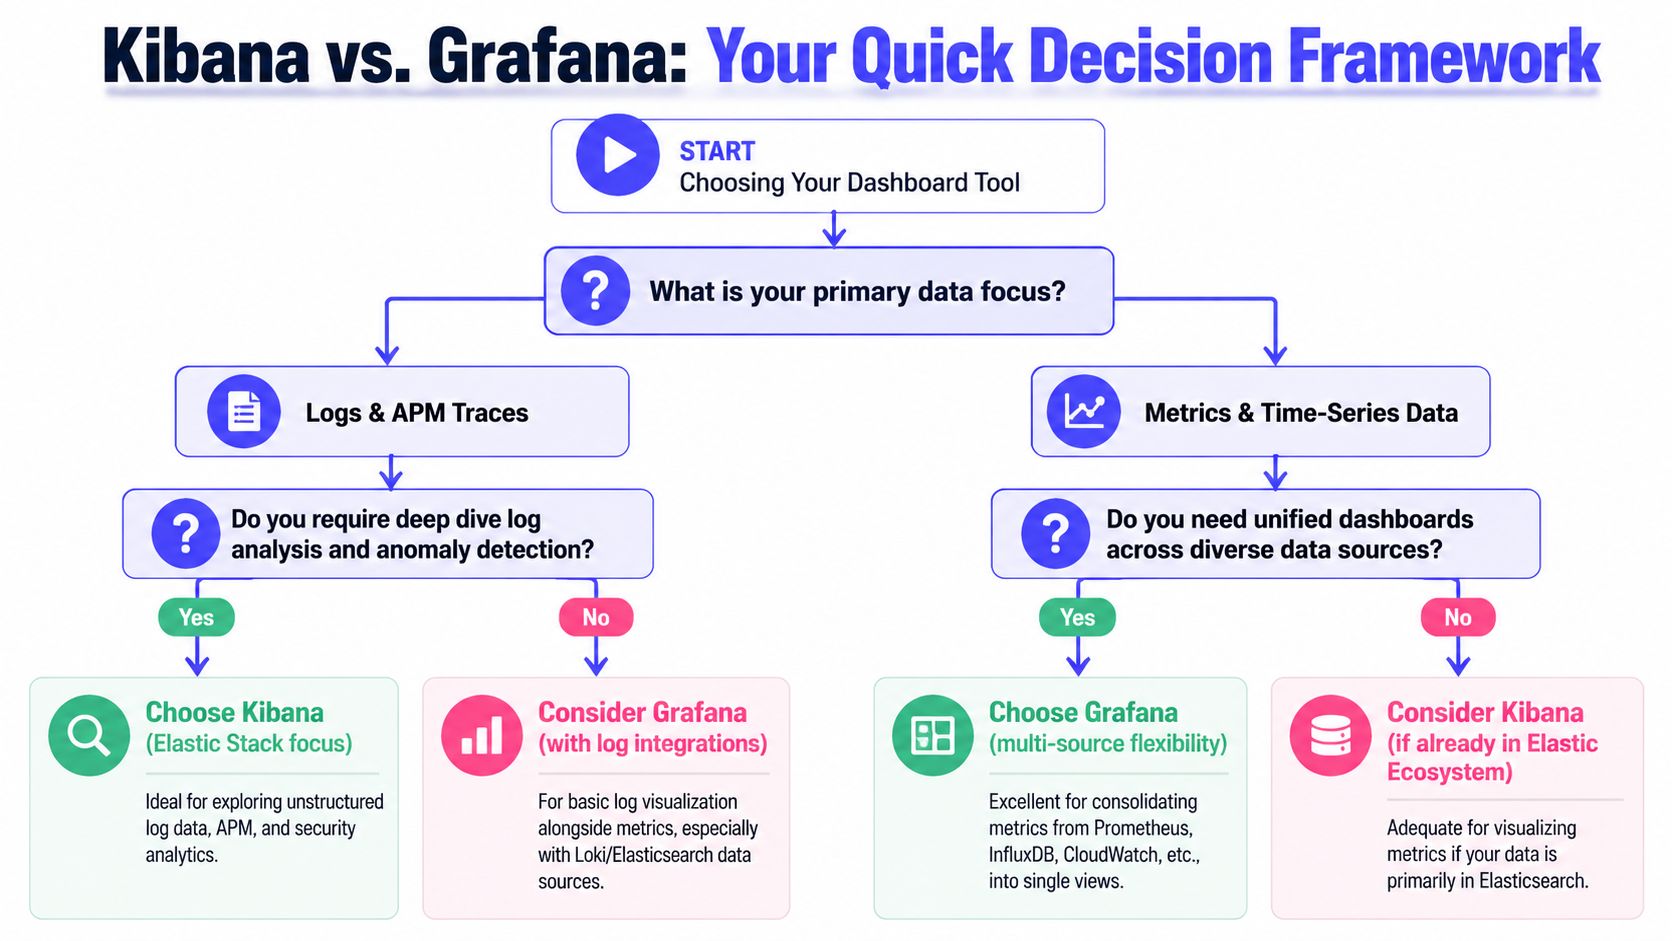
Choose Kibana if Elasticsearch is already the center of your logging, security, and investigation workflow. Choose Grafana if you need one operational view across metrics, logs, databases, cloud services, and application telemetry from multiple back ends. For AI products, Grafana is usually the better standardization layer for platform health, GPU utilization, training pipelines, and service-level views. Kibana wins when incident response depends on fast search through large volumes of unstructured events.
Cost of ownership should drive the decision more than feature checklists. Kibana is cheaper to justify when you are already committed to Elastic and your team lives in that ecosystem. Grafana is cheaper to scale across a mixed stack because it avoids forcing every telemetry path through one storage engine. The expensive mistake is picking a tool that fights your data topology, then paying later in dashboard rewrites, retraining, and dual-tool operations.
A split model can work. It should be a deliberate exception, not the default standard. Use Grafana as the shared dashboard and alerting surface. Keep Kibana for Elasticsearch-heavy forensics if your SRE or security teams depend on it.
Teams often start with a broader observability showdown comparison and then realize the harder question is operating model fit, not UI preference.
If you are standardizing for a growing AI product, use this rule. Pick Kibana when search is the product of your observability stack. Pick Grafana when observability is a control plane that has to sit above many systems.
Good dashboards still matter. Before you standardize, apply these data visualization best practices for operational dashboards so your team does not mistake prettier charts for better observability.
| Decision area | Kibana | Grafana |
|---|---|---|
| Best fit | Elasticsearch-centric environments | Mixed-source environments |
| Primary strength | Log investigation, event search, security analysis | Metrics, dashboards, alerting across many systems |
| Query model | KQL, Lucene, Elasticsearch-native workflows | PromQL, SQL, LogQL, and source-specific queries |
| Best for AI teams | Inference failure analysis, audit trails, security events | Training telemetry, cluster health, latency, throughput, GPU and queue monitoring |
| Main TCO risk | Elastic lock-in, cluster tuning, and storage decisions tied together | Query sprawl, uneven dashboard quality, and governance across teams |
| Migration pain | Higher if teams depend on Elastic-specific dashboards and saved objects | Higher if every team builds against different data sources and query conventions |
A Quick Decision Framework for Kibana vs Grafana
It is 2 a.m. Your inference API is timing out, GPU nodes are saturated, and a large customer wants an update before the next business hour. The wrong observability standard turns that incident into three searches, four dashboards, and a Slack thread full of conflicting screenshots. The right one cuts mean time to answer and keeps tooling costs under control as your AI product grows.
Start with a blunt question. Where does your team spend its investigation time?
Start with the operational question, not the feature list
Choose Kibana if engineers usually work backward from an event. Failed requests, security alerts, audit trails, prompt abuse, indexing issues, and root-cause analysis inside Elasticsearch all point in that direction. Kibana is strongest when search is the core workflow and Elastic is already your system of record.
Choose Grafana if engineers usually work from system behavior over time. Latency shifts, queue buildup, GPU utilization, token throughput, training job regressions, and service health across clusters point to Grafana. It fits teams that manage time-series data across several stores and need one place to compare them.
Then price the operating model you are standardizing
This is a TCO decision before it is a UI decision.
Kibana usually costs less to run if your logs, traces, and security data already live in Elastic and your team knows that stack well. You avoid translation work, duplicate pipelines, and cross-tool drift. The tradeoff is tighter coupling. Storage choices, retention policy, query behavior, and dashboard design stay tied to Elastic.
Grafana usually costs less to standardize if your telemetry is already fragmented and you do not plan to force everything into Elasticsearch. It sits above mixed systems cleanly. That lowers migration pressure in the short term, but it creates governance work. Without standards, teams end up with inconsistent queries, duplicate dashboards, and alert rules nobody trusts.
Use this CTO rubric
Pick Kibana if three or more of these statements are true:
- Elasticsearch is already the canonical store for operational data.
- Security investigation and log forensics matter as much as uptime dashboards.
- Your incident workflow starts with request-level evidence, not metric anomalies.
- You want fewer moving parts, even if that increases dependence on one vendor.
- Inference monitoring depends heavily on searchable event payloads, audit logs, and traceable user actions.
Pick Grafana if three or more of these statements are true:
- Metrics live in Prometheus or another time-series backend.
- Logs, metrics, and business signals are spread across multiple platforms.
- Platform, SRE, and MLOps teams need a common control plane.
- You expect acquisitions, cloud changes, or data-store changes in the next 12 to 24 months.
- Training and inference need different monitoring patterns. For example, training needs trend analysis and resource saturation, while inference needs latency, throughput, and time-series anomaly detection for production drift and spikes.
Make the migration path part of the decision
If you choose Kibana, commit to Elastic as more than a dashboard layer. That is the only way the economics work. If you choose Grafana, define source ownership, dashboard conventions, and alerting rules before teams build their own versions of the truth.
A stalled decision usually means leadership has not agreed on what the tool is supposed to optimize for. Faster investigations, lower platform cost, easier migration, or broader source coverage are different goals. This short guide on how to improve leadership decisions is useful if your architecture choices keep stalling in committee.
Practical Examples in Production Architectures
A growing AI company usually hits this point around the same time. The product team wants one place to watch inference latency. The platform team wants Kubernetes and GPU visibility. Security wants searchable audit trails. Finance wants to know which choice will force a larger platform bill six months from now.
That is why architecture examples matter more than feature tables. The right choice depends on where telemetry already lives, which team owns incident response, and how expensive it will be to normalize data before anyone can use it.
Example one with Grafana for platform and model metrics
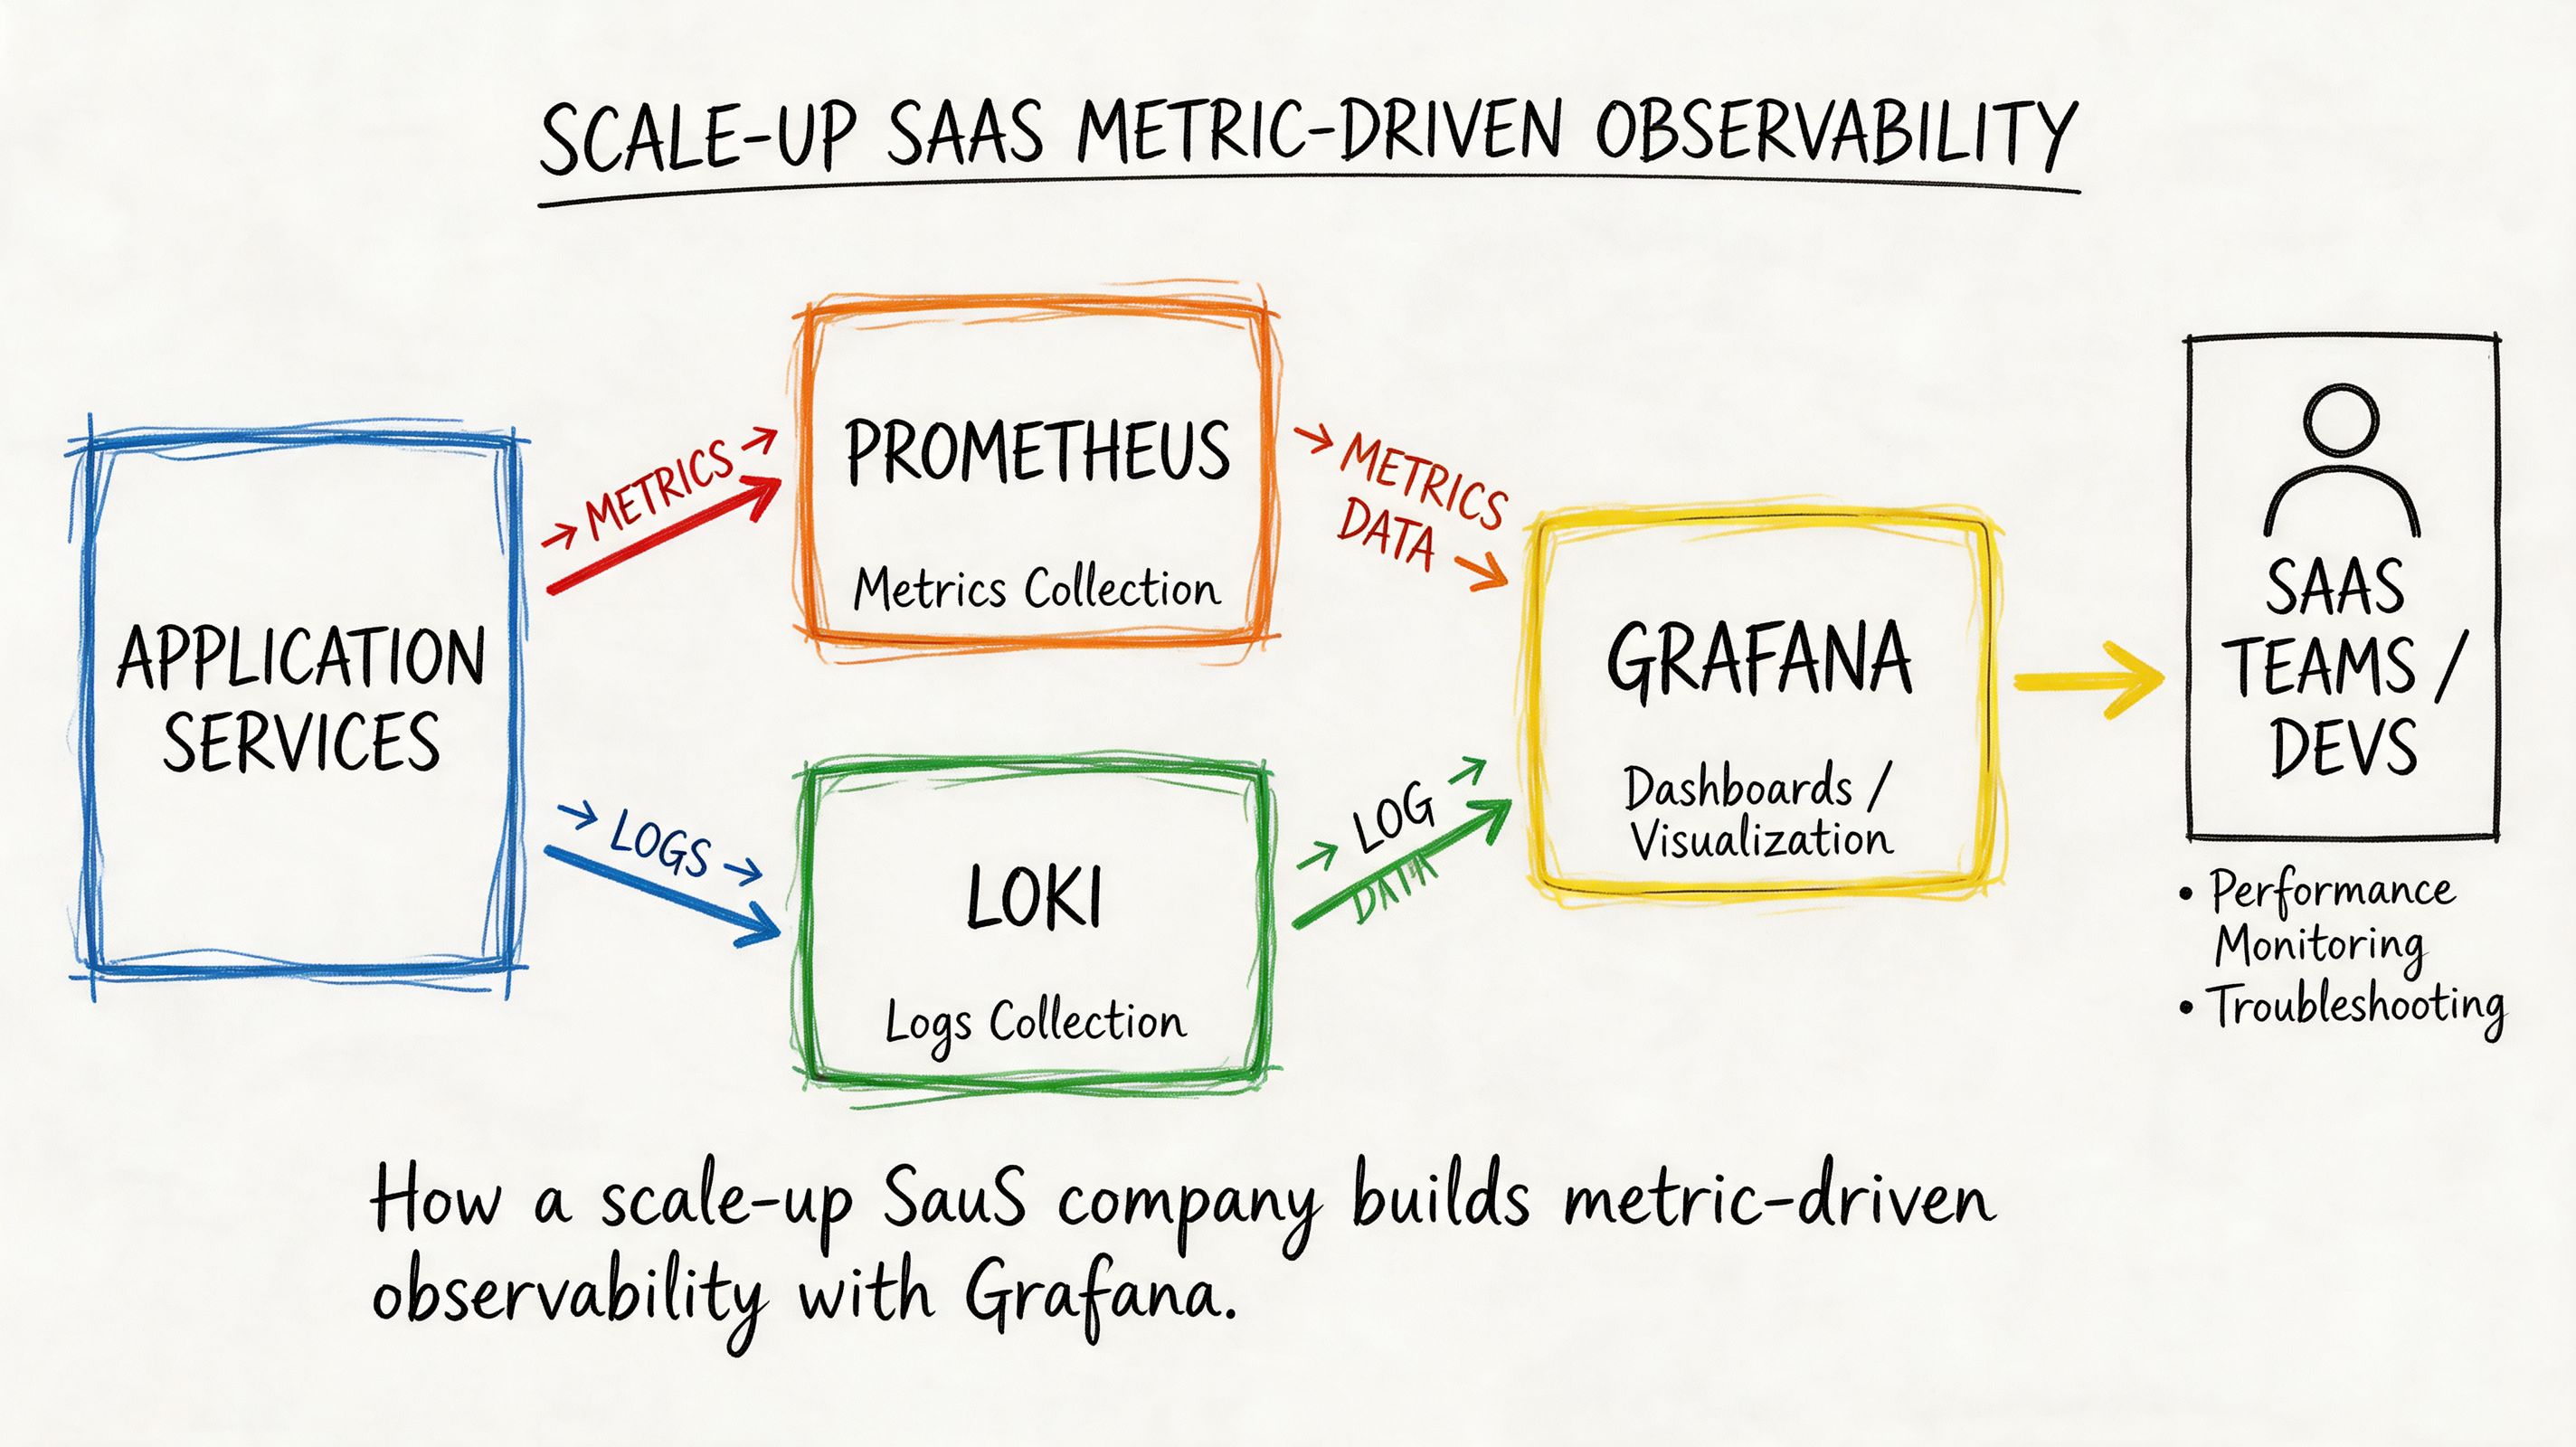
A Series B SaaS company runs a retrieval-augmented generation pipeline, batch feature jobs, and a Kubernetes-based inference layer. Metrics sit in Prometheus. Application logs go to Loki. Business counters and job metadata live in PostgreSQL.
They standardize on Grafana because the expensive part is not dashboards. It is moving and reshaping data. Grafana lets them keep each source where it already fits operationally, then present one view for engineers and leadership.
Their dashboard layout follows incident flow, not vendor categories:
- Top row: inference latency, error rate, token throughput
- Middle row: Kubernetes node pressure, pod restarts, GPU utilization
- Bottom row: queue backlog, feature pipeline freshness, revenue-sensitive conversion events
That structure fits AI operations well. Inference incidents usually start with latency or error spikes, then move into container health, saturation, and queueing. Training and feature pipelines need trend monitoring over longer windows, while serving needs fast reads on hot-path regressions. If your team is building drift or spike detection on those signals, pair this setup with time-series anomaly detection for production telemetry.
A representative PromQL panel for latency might look like this:
histogram_quantile(0.99,sum(rate(http_request_duration_seconds_bucket{service="inference-api"}[5m])) by (le))This gives the on-call engineer an answer fast. Is the issue at the API edge, inside model serving, or in a downstream dependency?
Grafana is the better default when your migration path matters. You can start with Prometheus and cloud metrics, add logs later, then bring in product or cost signals without rebuilding the whole stack around one storage engine. That lowers switching cost if your team changes clouds, adopts a managed metrics backend, or replaces one logging system after an acquisition.
Example two with Kibana for log-centric investigation and security
A larger enterprise AI platform has a different operating model. They serve internal models to multiple business units. Their worst incidents are not dashboarding problems. They are access disputes, policy violations, failed requests with messy payloads, and investigation-heavy incidents across long log histories.
They choose Kibana because Elasticsearch is already the system of record for operational logs and audit events. In that setup, Kibana cuts investigation time. Analysts can search raw request context, filter by actor and outcome, save views for repeat incidents, and keep security workflows close to the underlying data.
A KQL query for suspicious access exploration might look like this:
service.name : "model-gateway" and event.outcome : "failure" and user.name : *That is a good fit for AI inference environments that need request-level accountability. If legal, compliance, or internal security reviews matter, searchable event payloads often matter more than a prettier metrics dashboard.
Kibana also has a TCO advantage in one specific case. It is cheaper organizationally when you have already committed to Elastic for ingestion, storage, retention, and search. Adding Kibana on top of that stack is straightforward. Trying to use Kibana without that broader Elastic commitment usually creates more work, because the team still has to pipe data into Elasticsearch before Kibana becomes useful.
A short product walkthrough can help if your team hasn't used Kibana extensively before:
What these two examples actually tell you
Use Grafana when your observability estate is already split across metrics, logs, SQL data, and cloud services, and you want to reduce migration friction.
Use Kibana when logs, audit events, and investigation workflows drive the buying decision, and Elastic is already part of the core platform.
| Production pattern | Better default |
|---|---|
| Kubernetes, Prometheus, Loki, SQL, cloud metrics | Grafana |
| Elastic-heavy logs, audit trails, security workflows | Kibana |
| Product and business metrics on the same dashboard as infra | Grafana |
| Search-first debugging across huge text datasets | Kibana |
For AI teams, the clearest rubric is simple. If training observability, inference performance, and business KPIs live in different systems, choose Grafana. If incident response depends on deep search across request logs, user actions, and audit history, choose Kibana.
Deep Dive on Core Technical Differences
A CTO should judge Kibana vs Grafana by control plane design, operator skill requirements, and future migration cost. The UI matters less than the operating model you are standardizing.
Data sources and query languages
Grafana works best as a federated observability layer. It sits across many back ends and lets teams pull metrics, logs, traces, and SQL-backed business data into one place. For an AI product, that usually matches reality. Training jobs, GPU metrics, feature pipelines, inference latency, and product KPIs rarely live in one store.
Kibana is built around Elasticsearch. That is its strength. The product assumes your logs and event data are indexed there, and the rest of the experience follows from that assumption. Search, filters, saved queries, and document exploration all feel tighter because they share one underlying engine.
The cost is in the query model your team has to support.
Grafana spreads complexity across the stack. Your SREs may need PromQL for infrastructure metrics, LogQL for Loki, SQL for warehouse-backed dashboards, and vendor-specific query syntax in a few edge cases. That flexibility is valuable when you are integrating existing systems instead of replacing them. It also raises onboarding cost and makes dashboard quality more dependent on platform standards.
Kibana narrows that complexity. Teams usually operate through KQL, Lucene syntax, and Elasticsearch aggregations. That is easier to train for if your telemetry strategy is already Elastic-centered. It is a poor fit if your platform team is trying to avoid hard dependency on one storage layer.
For AI and MLOps teams, this becomes a staffing and migration decision. If your inference platform, feature store, and business reporting already live in different systems, Grafana reduces forced consolidation. If root cause analysis depends on high-volume log search and indexed event history, Kibana gives operators a cleaner investigation path.
Visualization and dashboarding
Grafana is the better choice when dashboards are a shared operating surface across engineering, product, and finance. It is strong at templated time-series views, variable-based filtering, and side-by-side presentation of technical and business signals. That matters for AI products where token cost, GPU utilization, model latency, queue depth, and customer-facing SLAs need to be reviewed together.
Kibana is stronger when a dashboard is the start of an investigation. A chart leads into filtered documents, raw events, and ad hoc search over indexed fields. That workflow is useful for tracing a bad deployment, a spike in inference errors, or suspicious access activity through actual event records instead of summarized metrics.
Use a simple test. Ask what your on-call team does after spotting a red panel.
- If they compare trends across systems and decide capacity or routing changes, Grafana is the better default.
- If they immediately drill into logs, request payload history, or audit records, Kibana is the better default.
For training workloads, Grafana usually has the edge because operators care about job duration, GPU saturation, throughput, data pipeline lag, and experiment-level comparisons across multiple systems. For inference workloads, the answer depends on failure mode. If you mainly watch latency, saturation, and cost, choose Grafana. If you regularly investigate malformed requests, customer-specific errors, and event trails, Kibana earns its keep.
Alerting and notification workflows
Alerting should follow the source of operational truth.
Grafana fits teams that alert from several systems at once. If your production posture depends on Prometheus metrics, cloud monitoring, SQL-based business checks, and log-derived signals, Grafana gives you one place to manage alert rules and route notifications. That reduces dashboard sprawl and lowers the odds that every team invents its own alerting stack.
Kibana fits teams whose incidents are driven by Elasticsearch data and Elastic-native workflows. It is especially effective for log thresholds, anomaly detection on indexed events, and investigation flows where the alert opens directly into the search context operators need.
Do not force one tool to do both jobs if it increases operational drag. A common steady state is Grafana for cross-system visibility and Kibana for Elastic-heavy investigation. Standardize only where consolidation lowers cost.
Where each one gets awkward
Grafana gets awkward when:
- teams want one query language, but the platform spans too many back ends
- dashboard ownership is weak, so every group builds different panels against different sources
- data quality problems remain in the source systems and surface as conflicting dashboards
Kibana gets awkward when:
- leadership expects it to act as a neutral UI for a heterogeneous stack
- metrics and business reporting live outside Elastic, but teams still try to centralize everything in Kibana
- the platform roadmap starts bending around Elasticsearch adoption instead of workload needs
My technical recommendation
Use Grafana as the standard front end if your AI platform is already distributed across Prometheus, cloud services, SQL systems, tracing tools, and separate stores for training and inference telemetry. It keeps migration options open and lowers the cost of integrating what you already run.
Use Kibana as the standard if Elasticsearch is the center of gravity and your highest-value workflows depend on search-first investigation across logs, events, and audit history. In that model, Kibana is not just a dashboard tool. It is part of the operational database experience.
| Decision question | Better default |
|---|---|
| Need one observability layer across mixed back ends? | Grafana |
| Need search-first investigation on indexed event data? | Kibana |
| Need broad visibility for training systems, inference health, and business KPIs? | Grafana |
| Need fast drill-down into logs, audit events, and request history? | Kibana |
Make the choice based on where complexity lives. Grafana handles complexity across many systems. Kibana handles complexity inside the Elastic system.
Comparing Scalability Security and Cost
Most kibana vs grafana articles stay too shallow. Features don’t decide platform cost. Operations do.
Scalability and performance behavior
Kibana benefits from Elasticsearch specialization. According to this performance-focused comparison, Kibana’s query performance is optimized for Elasticsearch’s distributed architecture, enabling rapid full-text search and aggregation across terabytes of log entries. That’s exactly why Elastic-heavy teams keep choosing it.
But the same specialization creates a real trade-off. Performance can degrade with complex aggregations or poorly indexed data. In practice, your dashboard experience becomes tightly linked to cluster sizing, index design, and Elasticsearch discipline.
Grafana behaves differently. It’s lightweight and doesn’t store the data itself. It delegates the heavy work to underlying sources, which allows it to scale independently of raw data volume. That architecture is simpler to reason about if your stack already has competent source systems such as Prometheus, Loki, or managed SQL back ends.
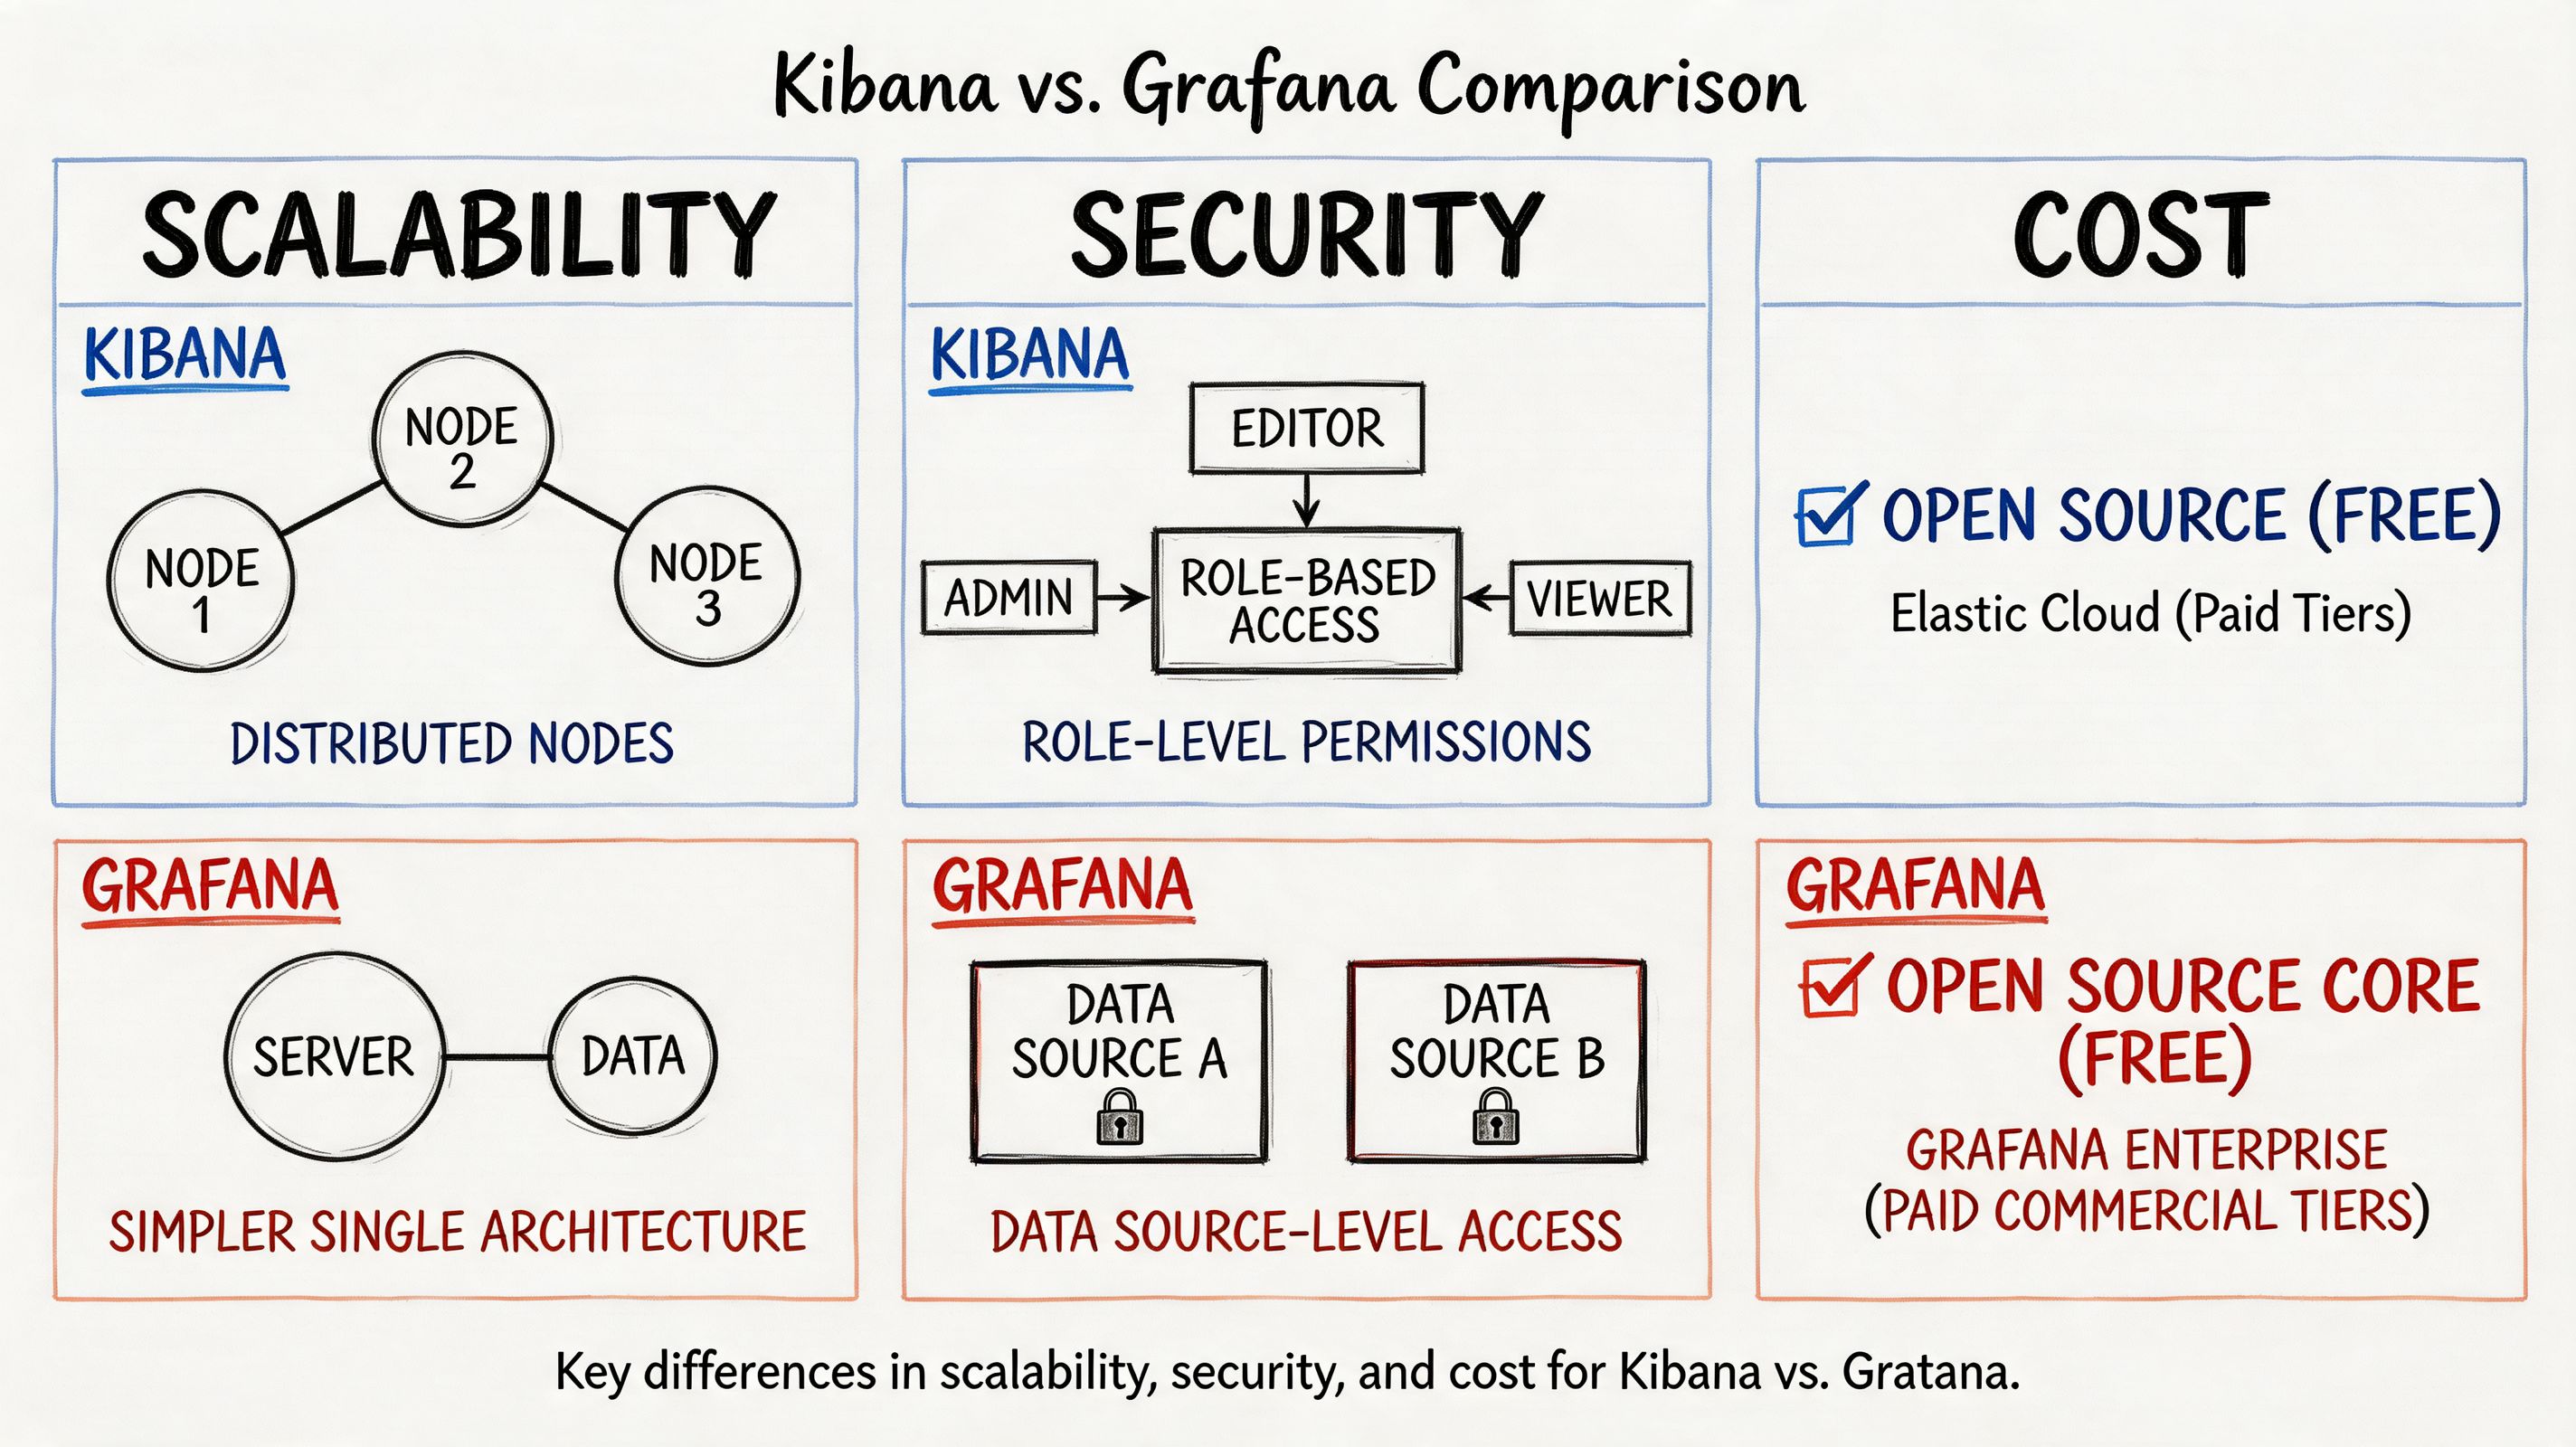
Security and tenancy model
Security isn’t just authentication. It’s about how safely you can let different teams work in the same tool without stepping on each other or seeing the wrong data.
Kibana is strongest when access control follows Elasticsearch boundaries and Elastic-native organizational patterns. If your security team already governs data there, Kibana fits naturally.
Grafana is usually easier to position as a cross-team dashboard layer because it sits above many sources and can separate teams by folders, dashboards, and source access patterns. That doesn’t automatically make it more secure. It makes it easier to align with mixed environments where one company has several telemetry systems.
Security design should follow your source-of-truth model. If data governance is Elastic-centric, Kibana is the cleaner choice. If governance is federated across multiple operational systems, Grafana is often easier to manage.
The TCO question most teams miss
License discussions are usually the least interesting part of total cost of ownership.
The cost sits in five buckets:
Infrastructure overhead
- Kibana cost is tied to Elasticsearch footprint and operational tuning.
- Grafana cost is tied to how many data sources you connect and how healthy they are.
Engineering specialization
- Kibana demands stronger Elasticsearch operating knowledge.
- Grafana demands broader source literacy and dashboard governance.
Operational sprawl
- Grafana can become a dashboard jungle if nobody owns naming, variables, and panel standards.
- Kibana can become Elastic lock-in if teams keep pushing every new telemetry need into Elasticsearch.
Incident workflow efficiency
- Kibana often reduces friction for log-heavy triage.
- Grafana often reduces friction for cross-system visibility.
Future migration pain
- The more you entrench in either tool’s query habits and saved assets, the more expensive a later switch becomes.
- Elasticsearch is already strategic
- log search and event analysis drive incident response
- security and audit teams are major stakeholders
- you operate a heterogeneous stack
- metrics and service health are the daily operating surface
- you want one place to overlay technical and business telemetry
- Which prompts triggered the failure pattern?
- Which tenant saw malformed responses after the model gateway change?
- Which tool invocation chain caused the agent to loop?
- Which security or policy event lined up with the bad output?
- Training and infrastructure monitoring: Grafana
- Inference SLOs and service health: Grafana
- Request forensics and event search: Kibana, if Elastic already exists
- Security, audit, and log-heavy investigations: Kibana
- One default tool for a heterogeneous stack: Grafana
Dashboard rewrite work
Existing saved objects rarely map neatly from one tool to the other.Query retraining
A team fluent in KQL won’t instantly become good at PromQL. The reverse is also true.Parallel-run complexity
During transition, operators often need both tools. That creates confusion about which dashboard is authoritative.Incident risk
Migration periods create blind spots. The fastest way to lose confidence in observability is to change it during a scale-up.- Are we changing because the current tool is wrong, or because our implementation is weak?
- Which dashboards are operationally critical?
- Can we tolerate a period where two tools coexist?
- Who owns query translation, dashboard QA, and alert parity?
- Primary data type: Mostly logs and indexed events, or mostly metrics and time-series?
- Source diversity: One Elastic-centric store, or several operational back ends?
- Team skills: Stronger in KQL/Lucene, or stronger in PromQL/SQL and metrics workflows?
- AI workload shape: More training and infra monitoring, or more inference log investigation?
- Governance need: One specialist tool, or one shared dashboard layer across teams?
- Migration risk: Can you absorb retraining and dashboard rewrite work right now?
- Score your current environment.
- Pilot the winning tool on one production-critical workflow.
- Decide whether you want one standard platform, or a deliberate two-tool model.
My cost-first recommendation
If you’re optimizing for least regret over three years, pick the tool that matches your existing telemetry architecture, not the one with the prettier demo.
Choose Kibana when:
Choose Grafana when:
| Cost driver | Kibana risk | Grafana risk |
|---|---|---|
| Platform dependence | High dependence on Elastic | Lower dependence on one vendor, higher dependence on source quality |
| Skill concentration | Elasticsearch expertise bottleneck | Multi-query-language sprawl |
| Dashboard governance | Usually more bounded by Elastic workflows | Can sprawl across teams quickly |
| Long-term flexibility | Lower if you move away from Elastic | Higher if your stack keeps diversifying |
Choosing a Tool for AI and MLOps Workloads
Your AI product hits a growth wall when one dashboard tells you the cluster is healthy, another shows rising latency, and nobody can explain why a specific model output went wrong for a paying customer. At that point, the Kibana vs Grafana decision stops being a UI preference. It becomes a cost and operating model decision.
For AI and MLOps, I would not standardize based on a generic feature checklist. I would choose based on the failure mode you need to catch fastest, and the telemetry you can afford to store, query, and maintain over the next three years.
Choose Grafana for training platforms and inference service health
Grafana is the better standard when your AI team spends more time operating distributed systems than investigating individual requests.
Training pipelines, GPU pools, job queues, feature freshness, batch windows, vector store latency, autoscaling behavior, and cross-region serving health all fit Grafana well. It handles time-series telemetry across multiple backends cleanly, which matters when your stack already spans Prometheus, cloud monitoring, SQL, and managed services. That lowers TCO because you can keep the systems you already run instead of forcing every signal into one search engine.
It also maps better to the questions platform teams ask every day. Are trainers backlogged? Are inference pods saturating? Did token latency spike after a model rollout? Did retrieval performance degrade with a new index build?
If your core problem is operating ML infrastructure reliably, pick Grafana first.
Choose Kibana for inference forensics, traceable events, and security-sensitive debugging
Kibana earns its keep when incidents live inside event streams, not just metric curves.
Inference failures often require a request-level investigation. You need to search payload metadata, auth context, moderation outcomes, model routing decisions, tool-call logs, and error sequences across services. Kibana is stronger in that workflow when Elasticsearch is already part of the platform, because teams can pivot quickly from logs to indexed events to anomaly analysis without stitching together multiple tools.
That makes Kibana the better fit for teams asking questions like these:
For inference debugging and audit-heavy environments, Kibana usually gives operators a shorter path to the root cause.
My recommendation for a growing AI company
Standardize on Grafana as the primary operating surface if you are building a multi-service AI platform and want the lowest long-term coordination cost.
Keep Kibana as a specialist investigation tool only if Elasticsearch is already strategic for logs, security events, or request-level analysis. If Elastic is not already central, avoid introducing Kibana as a second center of gravity just for occasional debugging. That adds storage, query, training, and governance overhead that compounds as the team grows.
Use a simple rubric:
The split between training and inference matters. Training workloads generate operational signals at scale. Inference workloads generate customer-impacting events that often need searchable context. Treating both as the same observability problem leads to tool sprawl and wasted spend.
Teams building evaluation loops, agent monitoring, or release gates should also spend time understanding AI-driven testing approaches, because your observability stack only helps if you define the behaviors and failure patterns you need to verify.
If you are tightening rollout controls, monitoring standards, and rollback discipline, these MLOps best practices pair well with the tooling choice above.
Understanding Migration Paths and Switching Costs
People frequently discuss kibana vs grafana as if it’s a clean swap. It isn’t.
The hard part isn’t installing the new tool. The hard part is unwinding the habits, dashboards, saved searches, and team muscle memory built around the old one. As noted in this migration-focused comparison, the hidden cost of rewriting dashboards, retraining teams on PromQL vs KQL, and managing dual-tool monitoring during transition can be significant and can disrupt observability of production ML systems at critical growth points.
Where migration cost shows up
The migration test I’d use
Before approving a switch, ask four questions:
Don’t migrate front ends in the middle of platform turbulence unless the current architecture is actively hurting the business.
Your Decision Checklist and Next Steps
Use this scorecard with your platform lead, security lead, and head of ML.
Three next steps:
If you need engineers who’ve already built production observability for AI systems, ThirstySprout can help you hire vetted MLOps, platform, and data engineers fast. Use that support when the tooling decision is clear but your team needs hands-on implementation depth. Start a pilot, or bring in specialists who’ve worked with Grafana, Kibana, Prometheus, Elasticsearch, and real-world ML infrastructure.
Hire from the Top 1% Talent Network
Ready to accelerate your hiring or scale your company with our top-tier technical talent? Let's chat.