

In the UK, R-related hiring is still a small slice of the market, with IT Jobs Watch reporting 234 permanent jobs citing R in the 6 months to 7 Aug 2026, equal to 0.22% of all permanent UK jobs and 1.27% of the Programming Languages category (IT Jobs Watch). That's the right starting point for anyone scanning R programming jobs in 2026, because the language isn't dead, it's concentrated.
The job market treats R as a specialist tool. In the same dataset, the median annual salary is £57,500, with the 25th percentile at £33,750 and the 90th percentile at £102,500 (IT Jobs Watch). That pay spread tells you the work sits in analytics, statistics, and research-heavy teams, not broad general software hiring.
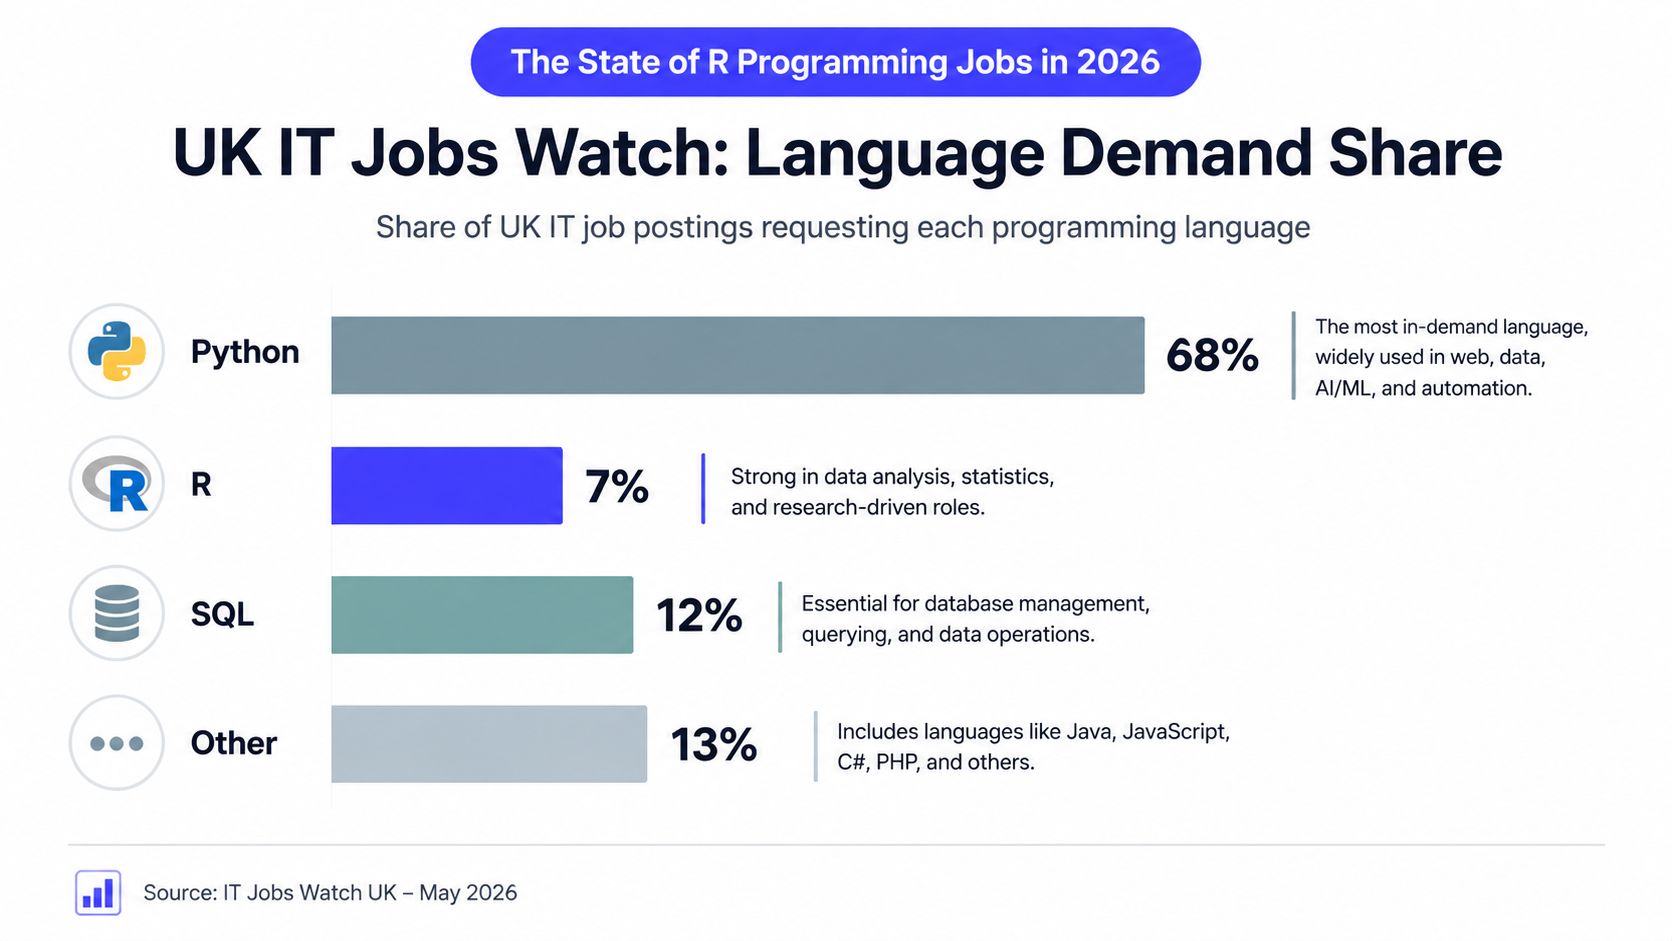
The State of R Programming Jobs in 2026
R is a niche market, not a mass market
The cleanest way to read R programming jobs is to stop thinking of them as one market. They're several submarkets stitched together, and the UK data makes that obvious. 234 permanent postings in six months is real demand, but it's not the kind of volume you see with mainstream languages, and the ranking drop from 375 in 2025 to 555 in 2026 shows how easy it is for candidates to misread the market if they search too broadly (IT Jobs Watch).
That doesn't mean R is weak. It means employers want it where statistical rigor matters, where teams care about methodology, and where reproducible analysis is part of the job. The median pay of £57,500 in the UK also says something important, this work is valued, but it's not usually generic CRUD software work.
Practical rule: if a job ad says “R” but the rest of the role reads like product engineering, you're probably looking at a mismatched requisition.
The US market is broader, but still segmented
The US picture is bigger and more layered. Coursera cites U.S. Bureau of Labor Statistics data showing data scientists earn a median pay of $112,590 and that related roles are projected to grow faster than average, while Coursera also reports that jobs requiring R have a median total pay of $86,000 annually (Coursera). ZipRecruiter's R programmer data puts the average yearly pay at $124,000, with most workers between $115,000 and $139,500 (ZipRecruiter).
That spread isn't noise. It reflects different mixes of contract work, regulated-industry work, and seniority. LinkedIn's 56,000+ R programming jobs and Zippia's 43,216 job openings show there's durable demand, but it's still a niche inside data analysis, biostatistics, healthcare, finance, and research-heavy teams (Coursera).
If you want a practical screening layer for that kind of fragmentation, Talent Pronto's conversational screening is a useful example of how teams can narrow a broad applicant pool without forcing every candidate through the same generic questions.
Five Common R Roles and What They Actually Do
Data analyst and data scientist
A data analyst in an R-heavy team usually cleans data, builds reports, and explains findings to non-technical stakeholders. A data scientist does that too, but with more modeling, more experimentation, and more ownership of the decision logic behind the analysis.
Tooling matters here. The analyst side leans hard on tidyverse, ggplot2, R Markdown, and Quarto. The scientist side still uses those, but often adds deeper modeling workflows and clearer communication around uncertainty. If you're applying for these roles, your resume needs to show outcomes, not just packages, and a strong reference point is a data scientist resume example that shows how to present analysis work in a hiring-friendly way.
Statistician and biostatistician
A statistician in R often works in research, academia, government, or a data-driven business. A biostatistician usually works closer to clinical trials, public health, or regulated life sciences, where the job is as much about defensible methods as it is about analysis speed.
These roles value interpretation, study design, and reproducibility. They're not “make a chart and ship it” jobs. They're the kind of roles where the candidate who can explain a derivation clearly usually outperforms the candidate who only knows how to write a script.
Quantitative analyst and production-flavored R engineer
A quantitative analyst uses R for research, risk, or financial modeling, often with strong spreadsheet-to-code translation skills. A production-flavored R engineer is different, and the gap matters. In some senior listings, employers explicitly ask for package development, Posit/RStudio Server Pro, Posit Connect, Package Manager, RUnit testing, and REST APIs (Analytics Insight).
That's no longer notebook-only work. It's software hygiene, deployment control, and maintainability. If you want those roles, you need to show that you can write code other people will run.
Hiring signal: the more a listing mentions package creation, tests, or APIs, the less it wants a pure analyst and the more it wants someone who can ship durable R code.
Industries That Hire R and Where Python Has Already Won
Where R still shows up in real hiring
R is strongest in industries where statistical depth matters more than language popularity. That includes pharmaceuticals and clinical research, biotech, public health and government statistics, academic research, and actuarial and quantitative finance. Those are the places where a clean model, an auditable workflow, or a submission-ready report matters more than building a web service.
Franklin University's career guide is useful here because it shows that R programmer roles are spread across multiple sectors rather than concentrated in one bucket. It also notes that many roles sit in computer systems design, education and hospitals, and scientific research, with only 33.3% in the largest listed category and 42.4% spread across other industries (Franklin University).
Where Python has already won
Python dominates where the work is broader and more platform-oriented. That includes web product analytics, machine learning engineering, and many NLP-heavy startups. If a team is building infrastructure around models, serving APIs, or shipping general-purpose software, Python is usually the default language.
The search mistake candidates make is simple. They apply to everything with “data” in the title, then wonder why the interviews don't fit. A better approach is to target the domain first, then decide whether R is the right language for that pocket of the market.
Salary Bands Across the US, UK, and India
The pay band depends on market, title, and job shape
R work pays very differently once you separate domain, contract type, and seniority. UK permanent roles cluster around a £57,500 median annual salary, with a low-end band at £33,750 and a high-end band at £102,500 (IT Jobs Watch). In the US, Coursera reports a median total pay of $86,000 for jobs requiring R, while ZipRecruiter lists an average yearly pay of $124,000, with most workers between $115,000 and $139,500 and top earners at $163,000 annually (Coursera, ZipRecruiter).
India follows a different pattern. 6figr reports that people who know R Programming earn an average of ₹24.6 lakhs, with most salaries ranging from ₹16.5 lakhs to ₹84.1 lakhs, a median of about ₹19.0 lakhs, and the top 10% above ₹39.5 lakhs (6figr).
| Market | Entry / 25th pct | Median | Senior / 90th pct | Top earners |
|---|---|---|---|---|
| UK | £33,750 | £57,500 | £102,500 | Not stated in source |
| US | $26.44 per hour at the 25th percentile, or $115,000 to $139,500 for most workers | $86,000 total pay | $139,500 range ceiling, per ZipRecruiter's 75th percentile band | $163,000 annually |
| India | ₹16.5 lakhs | ₹19.0 lakhs | ₹39.5 lakhs, top 10% threshold | ₹84.1 lakhs |
The pay jump usually comes from the work shape, not the language alone. Contract-heavy roles, regulated life-sciences work, and lead positions tend to sit higher than entry analytics jobs, while generalist “R developer” postings often pay less than the title suggests because the scope is narrower than the label implies. Remote roles can also anchor to one market's band even when the worker sits elsewhere, so the title alone will not tell you the actual rate. For a broader comparison with adjacent analytics roles, see this overview of AI engineering salary bands.
The R Toolset Hiring Managers Actually Want
The analysis stack
The hiring conversation around R is usually too vague. Real jobs want a stack, not just a language. At the analysis layer, that means tidyverse for data manipulation, ggplot2 for charts, and R Markdown or Quarto for reporting.
The reason is practical. Teams don't just want code that runs, they want outputs that can be reviewed, reproduced, and handed to someone else without a long explanation. A candidate who can clean data in dplyr, reshape it in tidyr, and publish a Quarto report is already more useful than someone who only knows syntax trivia.
The production layer
Senior listings go further. They may want Shiny for interactive apps, package development for reusable code, RUnit testing for validation, and REST APIs for integration (Analytics Insight). In regulated settings, that stack often sits alongside CDISC SEND/SDTM/ADaM standards, uncleaned source data, and submission-ready outputs, which means the developer has to think about traceability and derivation logic, not just modeling (Indeed).
Good R hiring doesn't ask whether a candidate “knows R.” It asks whether they can build repeatable analysis that survives review, handoff, and reuse.
For teams that need examples of how to describe this stack in a role brief, the internal guidance on R programming language examples helps translate tool names into task-level expectations. That's the point where many job descriptions get clearer, because the candidate can see exactly which layer they'll own.
Two Mini Cases From Real R Hiring
A senior statistical programmer in life sciences
A mid-sized biotech hires a senior statistical programmer to own validated analysis pipelines. The work centers on CDISC SEND/SDTM/ADaM, advanced R, and reproducible deliverables in tidyverse, ggplot2, Markdown, Quarto, and sometimes Shiny (Indeed).
The week is not glamorous, but it is consequential. One day goes into cleaning incoming clinical data, another into checking derivation logic, and another into packaging outputs for reviewers who care about traceability more than aesthetics. The stakeholders are statisticians, clinicians, and regulatory teams, so the job rewards people who can explain why a data step exists, not just how to code it.
A contract analyst in consumer insights
A consumer-insights firm brings in a contract R analyst to turn survey data into dashboards and recurring reports. This person usually spends more time in Shiny, tidyverse, and reporting workflows than in formal modeling, because the ask is fast turnaround and clear visualization.
The weekly output looks different from biotech work. The analyst is answering business questions, cleaning messy response sets, and publishing interactive views that account managers can use with clients. The deliverable is useful if it shortens the time between a survey closing and a decision being made.
Those two jobs share a language. They don't share the same risk profile, stakeholder map, or review process. That distinction is why broad “R developer” searches tend to underperform.
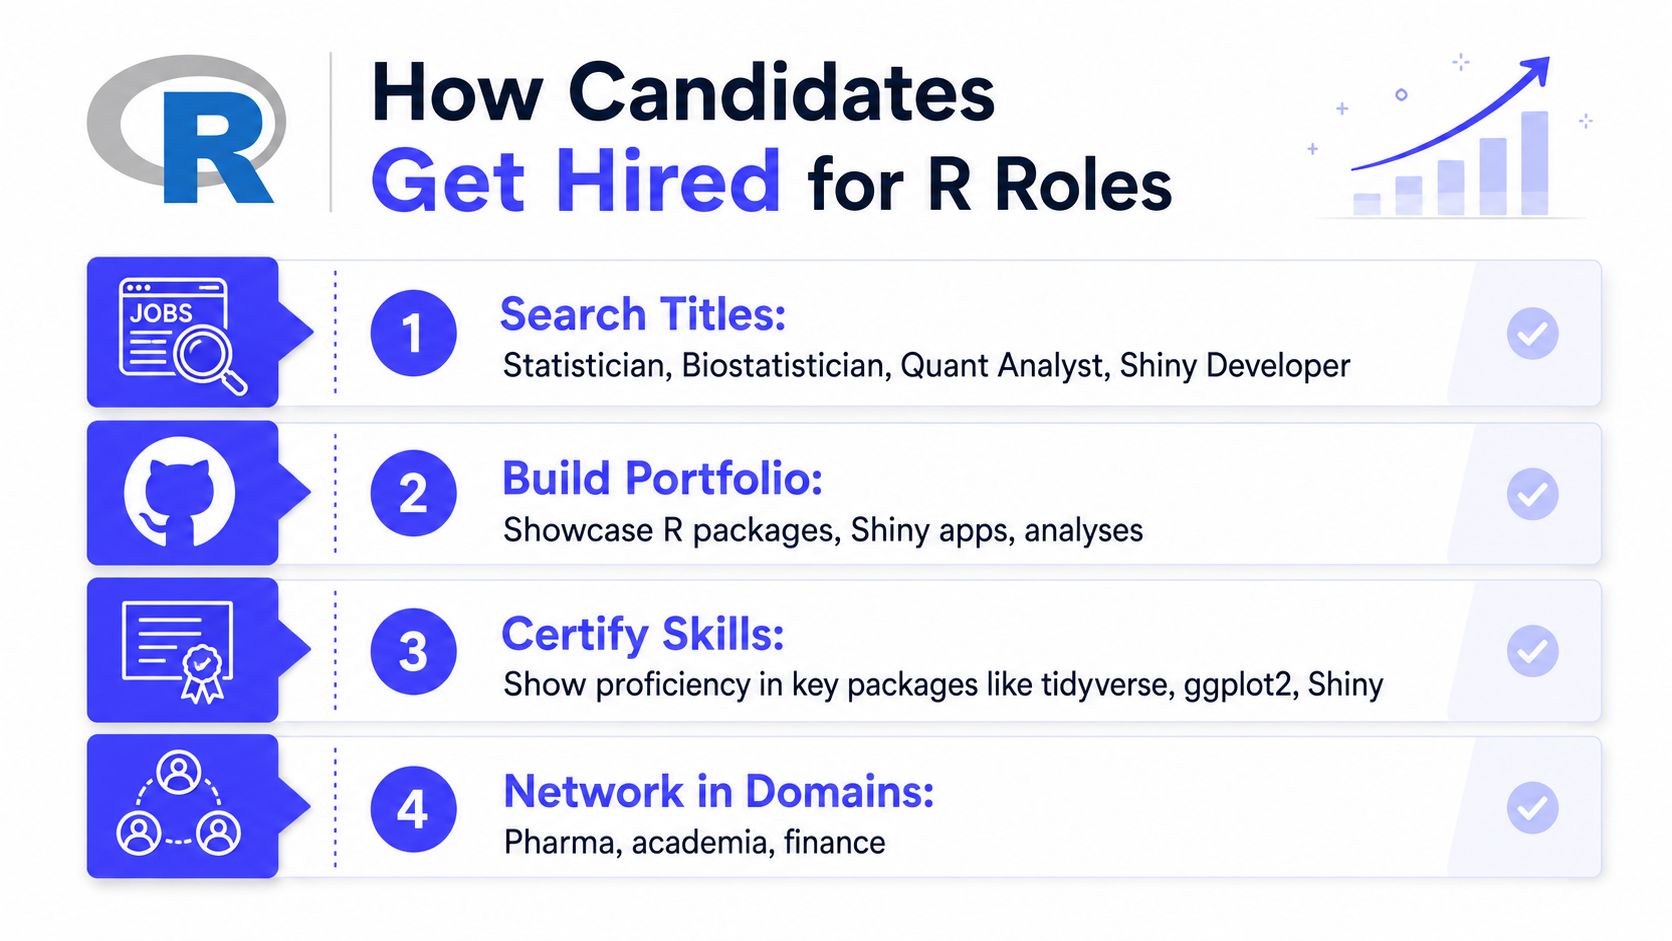
How Candidates Get Hired for R Roles
Search by title, not by language alone
The first mistake is typing only “R” into job boards. Better search terms are statistical programmer, biostatistician, quantitative analyst, Shiny developer, and R programmer. Franklin University's sector breakdown is the clue here, because it shows the jobs live in specific domains, not one generic bucket (Franklin University).
The second mistake is applying before you have proof. A small portfolio with 2 or 3 public GitHub repos does more than a long skills list if those repos show a Shiny app, a small R package, and a Quarto report. That combination says you can analyze, publish, and structure code.
Tighten the resume and interview story
Your resume should show outcomes tied to tools. Don't write “used R” and stop there. Write what the code did, what data it touched, and what the result changed for the team. If you're looking for inspiration on how to frame the story, hire a data scientist is a useful internal benchmark for how a role profile should read.
The interview usually follows a predictable pattern:
- Data manipulation: be ready to reshape, join, and clean a small dataset in R.
- Model interpretation: explain what the output means in plain English.
- Debugging: talk through why code failed and how you found the issue.
- Production judgment: answer one question about testing, deployment, or reproducibility.
Entry-level candidates often ask whether R alone is enough. It can be, if the role is explicitly analytical or statistical. Once the job title leans toward production, package work, or shared tooling, R by itself usually isn't enough.
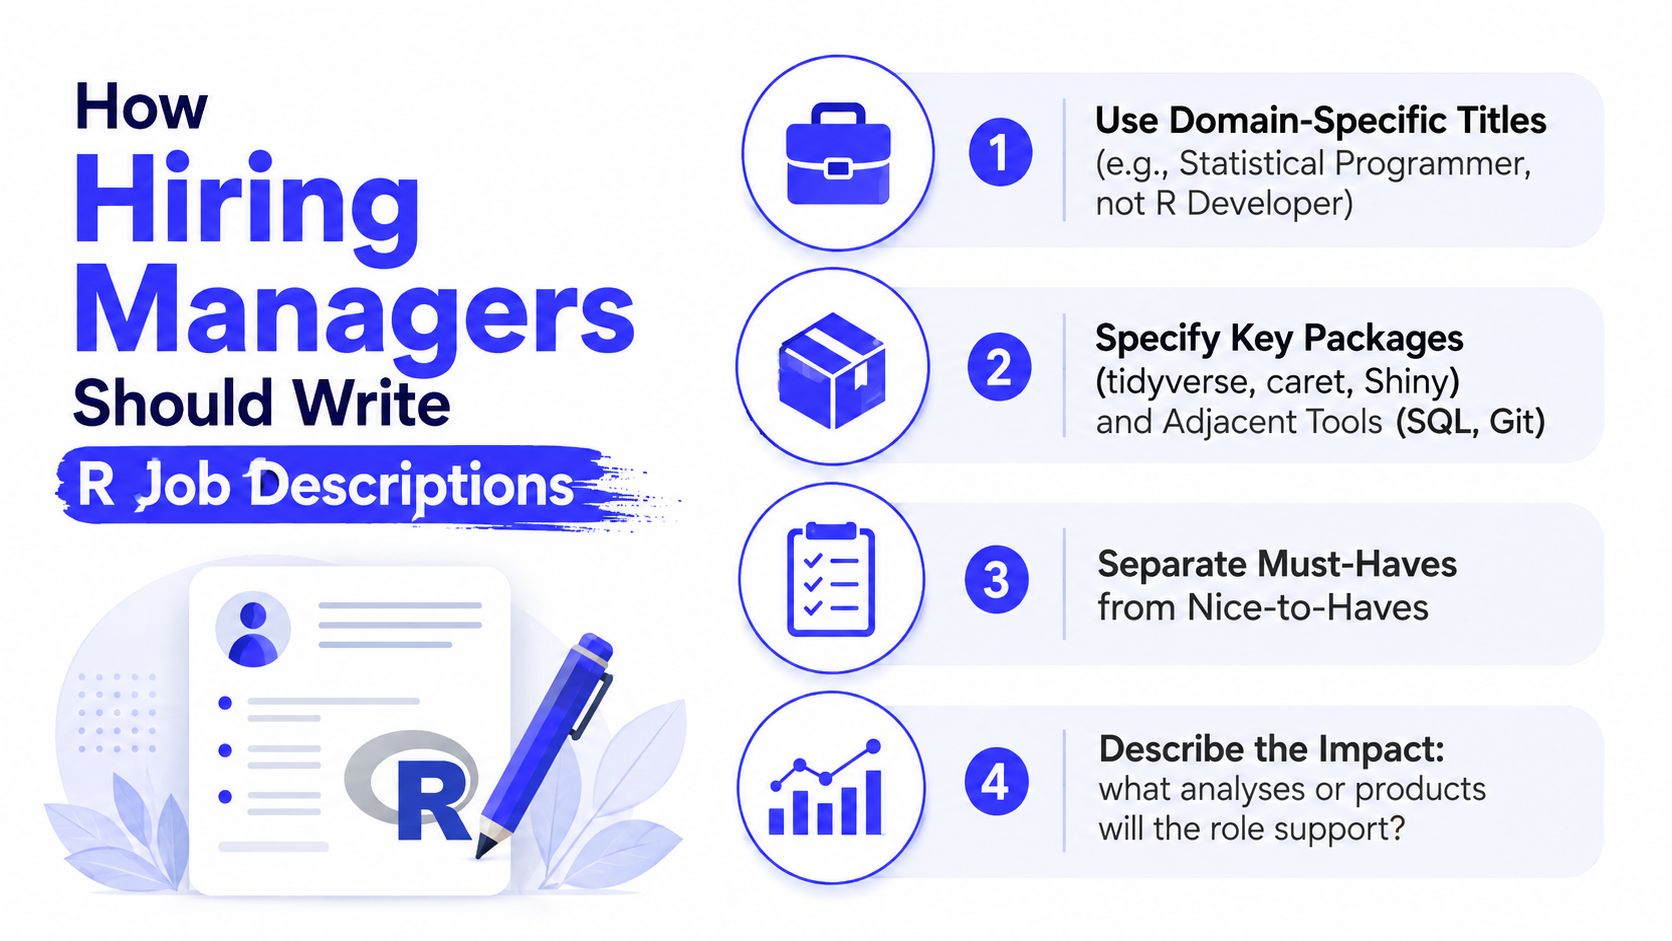
How Hiring Managers Should Write R Job Descriptions
Use the title the market actually searches for
If you want better applicants, stop writing “R Developer” by default. The better title is usually statistical programmer, biostatistician, quantitative analyst, Shiny developer, or data analyst with R. Those titles tell candidates what the job is, and they help the right people self-select before they apply.
The same logic applies to skills. A requisition that just says “R, statistics, communication” is too broad to be useful. Spell out the packages and adjacent tools, because that's what serious candidates scan first. The internal guide on build a target job description is a solid reference point for shaping a more specific req.
Separate must-haves from nice-to-haves
A strong R job description is explicit. It says which parts are essential and which are bonuses. That matters because candidates with deep domain knowledge may not have every tool, but they can often ramp quickly if the core expectations are clear.
A practical JD template looks like this:
- Title: Statistical Programmer, Clinical Analytics
- Must-have: advanced R, tidyverse, reproducible reporting, domain knowledge
- Nice-to-have: Shiny, package development, SQL, Git
- Impact: clean data, build validated reports, support submission or decision workflows
For evaluation, score four areas on a simple rubric, then compare candidates consistently:
| Dimension | What good looks like |
|---|---|
| Domain knowledge | Understands the clinical, finance, research, or survey context |
| Tidyverse fluency | Can clean, join, reshape, and summarize without hand-holding |
| Reproducibility habits | Uses Quarto, R Markdown, tests, or clear workflow structure |
| Collaboration | Explains trade-offs and works well with non-R stakeholders |
If you're hiring now and need candidates who can work inside this exact mix of domain depth and R workflow discipline, ThirstySprout can help you scope the role and surface vetted senior talent that fits the work.
Start by deciding which submarket you're hiring for, clinical, finance, public-sector statistics, or analytics, then write the role around that reality instead of around the language name. If you need help turning that scope into a short list of vetted candidates, ThirstySprout can support a focused pilot and help you move faster without widening the search beyond what the job needs.
Hire from the Top 1% Talent Network
Ready to accelerate your hiring or scale your company with our top-tier technical talent? Let's chat.