
It usually starts with a small miss. A source schema changes on Tuesday, a downstream model subtly drifts on Wednesday, finance questions a dashboard on Friday, and by Monday your data team is burning senior engineering time on triage instead of shipping the next AI feature. The pipelines still run. The system still fails the business.
That is the gap this article addresses. Production-ready data engineering is not a tooling checklist. It is an operating model for reducing delivery risk, controlling platform cost, and shortening the path from raw data to reliable product and ML outcomes. If you are deciding where to invest next, the right question is not which tool is popular. The right question is which practices lower incident volume, improve change safety, and keep time-to-market predictable as your data surface grows.
The 10 practices in this guide form a production-readiness framework. Each one matters on its own, but the business impact shows up in combination. Orchestration without testing still produces brittle releases. Data quality rules without lineage still leave you guessing during incidents. Documentation without ownership still leaves key decisions trapped in a few engineers' heads. I have seen teams spend heavily on storage and compute while the primary bottleneck was unclear ownership and weak review habits.
TL;DR:
- Treat data systems like production software. Use code review, version control, automated tests, logging, retries, and clear ownership. That lowers regression risk and cuts the cost of routine changes.
- Build for observability earlier than feels comfortable. Many teams adopt orchestrators and transformation tools before they can explain why a pipeline failed, how bad the blast radius is, or who should respond first.
- Design for latency pressure before the business formally asks for it. AI features, customer-facing analytics, and operational workflows tend to pull batch systems toward fresher data and tighter SLAs.
- Review capacity matters as much as coding capacity. If your team cannot reliably review pipeline changes, data contracts, and incident patterns, delivery slows and production risk climbs.
- Use a hiring-versus-building lens. Some gaps should be filled with experienced data platform hires. Others can be closed by giving existing backend, analytics, or ML engineers clearer standards and scorecards.
Who this is for: CTOs, founders, and staff-level engineers who have moved beyond MVP reporting and now need a data platform that can survive growth, audits, and AI roadmap pressure. If you are responsible for cost, reliability, and delivery speed at the same time, this framework is meant to help you make trade-offs clearly. For a broader leadership view, see these insights for AI startup CTOs.
Use three lenses to assess your current state:
- Flow layer: orchestration, storage, and transformation design
- Trust layer: validation, testing, lineage, and change control
- Ops layer: monitoring, incident response, documentation, and team capability
As you read the 10 practices, keep score against business outcomes, not just technical cleanliness. The useful questions are straightforward. Does this practice lower cloud waste? Does it reduce production risk? Does it help your team ship AI features faster without adding headcount every quarter? That is the standard for production readiness.
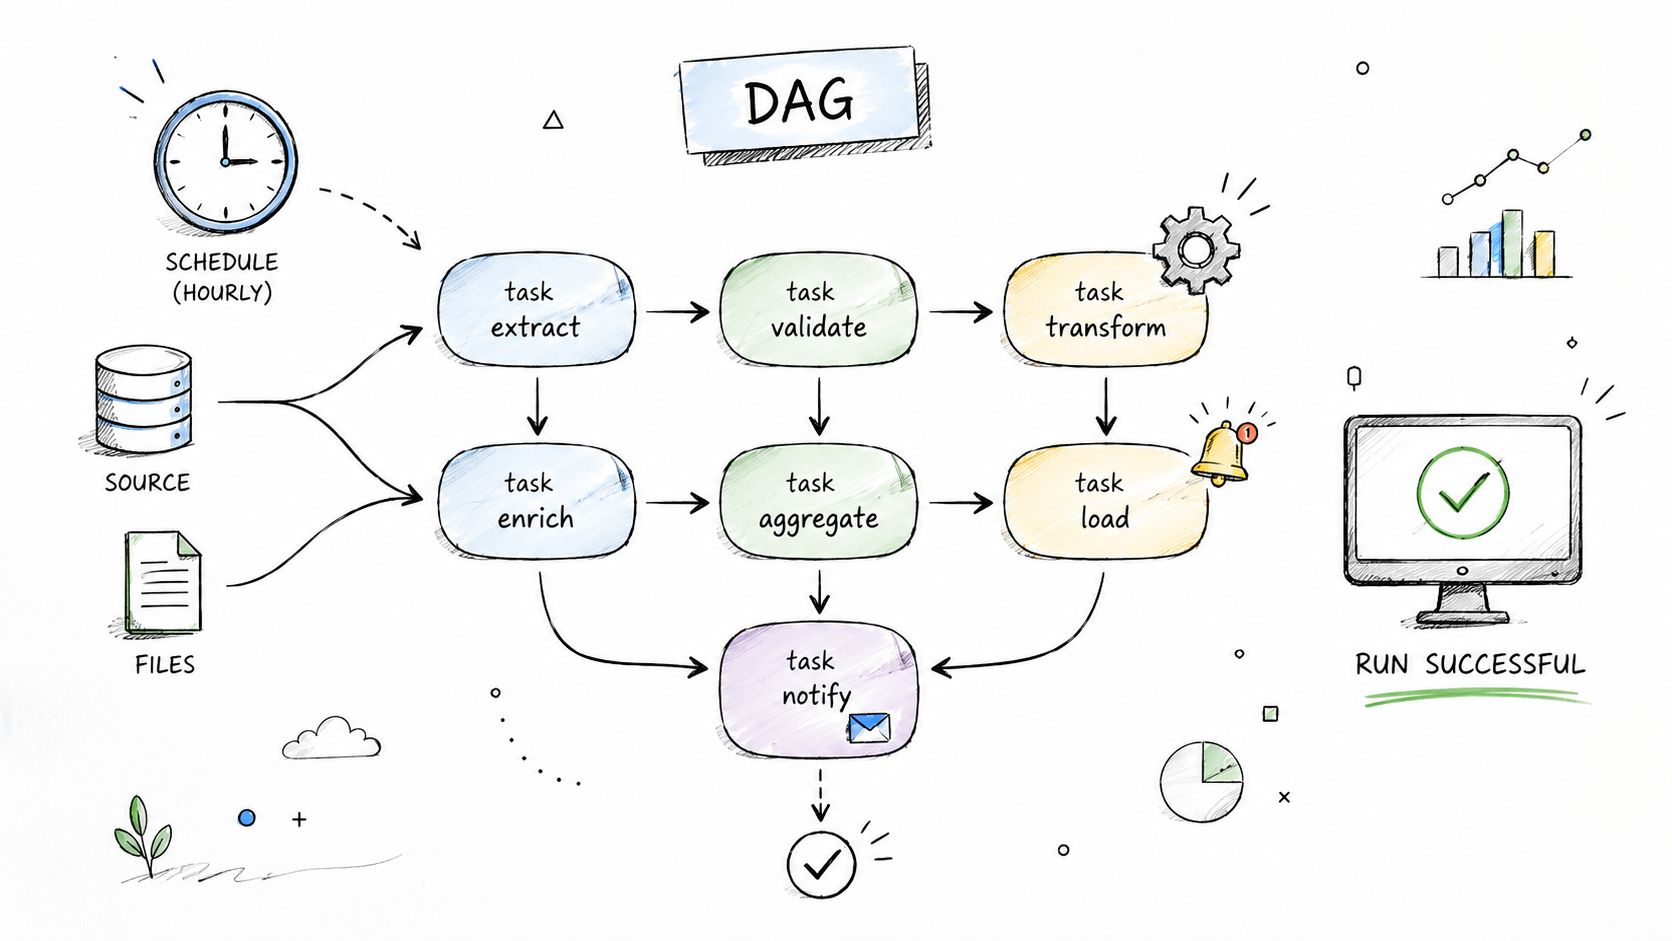
1. Data Pipeline Orchestration and Workflow Management
A quarter-end board meeting is a bad time to learn your revenue pipeline depends on three cron jobs, one analyst's shell script, and a Slack message that says “rerun if it looks off.” That setup works until the first missed dependency, late upstream drop, or duplicate load. Then you are paying for the same failure three times: cloud spend, engineering time, and lost confidence in the numbers.
Orchestration is the control plane for data delivery. Use it to define run order, retries, ownership, schedules, and failure handling in one place. Airflow and Prefect are common choices. As the 2024 survey cited earlier showed, orchestration has become standard in mature teams. The point is not tool popularity. The point is operational discipline.
A simple DAG view helps teams align on dependencies and failure points.
What works in practice
Organize workflows around business outputs, not technical stages. A daily billing reconciliation pipeline should exist because finance needs a trusted close process. A feature refresh pipeline should exist because ranking, fraud, or recommendation systems need fresh inputs on a known SLA. That framing improves ownership and makes cost and failure impact easier to measure.
Keep DAGs small enough that one team can reason about them during an incident. I usually split billing reconciliation, product usage aggregation, and feature refresh into separate workflows with clear inputs and outputs. Teams that combine ingestion, cleanup, transformation, backfills, and ML triggers into one graph save a little setup time up front and lose much more during failures.
Two patterns show up repeatedly in production:
- Finance close pipeline: ingest payment events, run schema and reconciliation checks, publish curated ledger tables, alert the finance owner on mismatch.
- AI feature refresh pipeline: ingest app events, deduplicate by event ID, compute rolling features, publish to online and offline stores, verify freshness before model consumers read.
A good test is simple. If one failed task sends engineers through six unrelated logs and two systems to answer “what ran, in what order, and what was written,” the workflow is too coarse or the ownership boundary is wrong.
Retries need restraint. Retrying an idempotent extract task is usually safe. Retrying a load that can write duplicate facts is how teams corrupt downstream reporting while the orchestrator reports “success.” Add checkpointing, partition-aware processing, and explicit success markers before you increase retry counts.
This practice has a direct business scorecard:
- Cost: lower rerun waste and less manual triage
- Risk: fewer silent dependency failures and duplicate writes
- Time-to-market: faster handoff between platform, analytics, and ML teams because schedules and dependencies are explicit
If your team is deciding whether to hire senior platform talent or build this skill internally, use the blast radius as the guide. If failed pipelines can delay revenue reporting, customer-facing ML features, or audit evidence, bring in someone who has operated orchestration in production. If the current need is limited to a handful of internal reporting jobs, a strong backend or analytics engineer can usually get there with clear standards and review.
If you're evaluating managed options or stack choices, a short demo like this is often enough to align infra and data teams:
2. Data Quality and Validation Frameworks
Most pipeline incidents aren't “the job failed.” They're “the job succeeded and produced garbage.” That's the expensive class of failure because it reaches dashboards, forecasts, product logic, and models before anyone notices.
The right move is to define quality checks at three levels. Schema checks catch obvious breakage. Row-level assertions catch malformed records. Distribution and business-rule checks catch the subtle failures that hurt trust.
A workable validation stack
A production validation framework usually includes:
- Schema validation: block unexpected column drops, type changes, or nullability shifts.
- Business validation: ensure invoice totals aren't negative, user country codes map correctly, and event timestamps aren't in the future.
- Freshness validation: alert when upstream data lands late or downstream models train on stale inputs.
Mini-case: a subscription SaaS team ingests Stripe, product events, and CRM updates. Their revenue dashboard doesn't break because the warehouse is down. It breaks because one source starts sending blank plan IDs and no one notices for hours. A simple rule to quarantine records with missing contract-critical fields keeps reports usable while the ingestion team fixes the source.
A second example is model features. If a recommendation job keeps running while category mappings collapse, your model quality degrades unnoticed. In that situation, fail the feature publish step even if the upstream extract succeeded.
Bad records should not get the same treatment. Some should block. Some should be filtered. Some should degrade gracefully with a visible warning.
That distinction is where mature teams separate “data hygiene” from operational control.
3. Version Control and Data Lineage Management
Monday morning, your CTO asks a simple question after a KPI swing in the executive dashboard: what changed on Friday? If your team needs Slack archaeology, warehouse query history, and three engineers to piece together an answer, the problem is not just process. It is production readiness.
Version control and lineage management give you change accountability. They tell you which transformation changed, who approved it, what data assets it touched, and which reports, features, or models depend on it. That matters because every unresolved data change slows incident response, raises audit risk, and pushes AI feature delivery further out.
Treat pipeline code, transformation logic, schema definitions, and deployment config the same way you treat application code. Put them in Git. Review them through pull requests. Tie merges to tests and deployment records. For teams tightening branching rules and review discipline, this guide on source code management practices is a useful reference.
Lineage is the second half of the system. Code history tells you what changed. Lineage tells you what the change affected.
What to version, and what to trace
Teams often stop at SQL files and DAG definitions. That is not enough in production. You need version history for:
- transformation code and orchestration definitions
- schema contracts and interface changes
- feature logic used by ML systems
- access policy changes tied to data assets
- documentation for business-critical metrics
You also need lineage that answers operational questions fast:
- Which source tables feed this revenue metric?
- Which models depend on this column before we rename it?
- Which training set and feature logic produced the current model output?
- Which downstream teams need notice before this change ships?
Mini-case: a growth team renames signup_source to acquisition_source in the event stream two days before a board review. Without lineage, the break surfaces in dashboards after the deploy, analysts patch around it, and nobody is sure whether the weekly conversion trend is wrong. With lineage tied into CI, the dependent dbt models and dashboards are flagged before merge. The owner updates downstream assets in the same pull request, and the board deck goes out on time.
That is the practical standard. Not because lineage diagrams look mature, but because they reduce decision latency.
A good implementation gives you three business benefits:
- Impact analysis: engineers can estimate the blast radius before a schema or logic change lands.
- Faster incident response: on-call staff can trace failures upstream and downstream without relying on memory.
- Auditability: finance, security, and compliance teams can see how a metric, report, or model input was produced.
There is a trade-off. Detailed lineage takes work to maintain, and fully automated lineage is rarely complete across BI tools, notebooks, reverse ETL, and ML workflows. Start with the assets that carry business risk: executive KPIs, customer-facing data products, billing, and model features that affect product behavior. If you try to map everything on day one, you create overhead without improving reliability where it counts.
The lineage map that matters is the one an on-call engineer can use during an incident, and a data lead can trust during a release review.
For the scorecard in this framework, rate yourself on four questions: can you trace a dashboard metric back to source tables, can you see downstream impact before a schema change, can you tie production outputs to a reviewed code change, and can a new engineer answer those questions without asking the original author. If the answer is no on two or more, you do not have enough control for a production data platform.
4. Infrastructure as Code for Data Systems
Manual setup is where environment drift starts. Someone changes a warehouse role in production, forgets staging, and your “works on my machine” story becomes “fails only in prod.” Infrastructure as Code, or IaC, removes that class of failure by making environments reproducible and reviewable.
For data systems, IaC should cover more than VPCs and compute. It should define warehouses, buckets, service accounts, network rules, secrets references, job schedules, and access policies. Terraform and cloud-native frameworks both work if you keep modules small and ownership clear.
Where teams go wrong
They often adopt IaC for core cloud infra but leave data resources as click-ops. That creates a split-brain operating model. Application infra is versioned. Data infra lives in consoles and memory.
Two examples make the difference clear:
- Staging parity example: a team provisions Snowflake roles, schemas, and grants via Terraform. Integration tests run against a realistic staging environment because the permissions model matches production.
- Recovery example: a bad permission change blocks your ingestion service. With IaC, you revert the reviewed config change. Without it, engineers spend the incident reconstructing prior settings by hand.
Use modules for shared patterns like warehouse users, event buckets, and per-domain schemas. Don't hide every detail behind abstraction, though. If nobody can tell what a module creates, reviews become ceremonial.
A useful rule is simple: if a platform engineer can't recreate the environment from Git, the system isn't production-ready.
5. Modular Data Transformation Design
Your team ships a pricing change on Tuesday. By Wednesday, finance, product, and the ML team are all reporting different revenue numbers. The root cause is rarely the warehouse. It is transformation logic spread across dashboards, notebooks, ad hoc SQL, and model code.
Modular transformation design reduces that risk by separating data cleanup, shared business logic, and consumer-specific outputs. The goal is not prettier SQL. The goal is controlled change. That matters if you care about close accuracy, incident rate, and how fast you can ship new AI features without breaking existing metrics.
A structure that holds up in production keeps layers explicit:
- Raw or staging models: light cleanup, typing, dedupe, source conformance
- Intermediate models: reusable business logic such as sessionization, revenue attribution, identity stitching, or entitlement joins
- Mart or serving models: tables shaped for a dashboard, API, reverse ETL job, or model consumer
Here is the business case. A B2B SaaS company defines “active customer” five different ways across product analytics, finance reporting, and customer success dashboards. Every team can defend its query. None of the numbers match in an executive review. The fix is a shared intermediate model with one reviewed definition, tests around edge cases, and named ownership.
The same pattern matters even more for AI work. Feature logic often starts inside training code because that is the fastest path to a first model. It becomes expensive later. Offline features drift from online serving logic, backfills get messy, and no one can answer which definition fed a launch decision. Pulling shared feature logic into reusable transformations gives analytics and ML teams the same input contract. That lowers model risk and shortens iteration time.
Shared business logic belongs in reusable models, not in dashboards or notebooks.
There is a trade-off. Modular systems add more files, naming rules, review overhead, and dependency management. Small teams can overdo it and build a maze of tiny models that nobody understands. The practical standard is simple. Create a module when a transformation is reused, business-defined, or costly to get wrong. Leave one-off presentation logic close to the consumer.
A useful scorecard for this practice:
- Low maturity: business definitions live in BI tools, notebooks, or application code
- Medium maturity: staged and curated models exist, but ownership and reuse are inconsistent
- High maturity: shared intermediate logic is versioned, tested, documented, and reused across analytics and ML workloads
This is also where org design shows up in your data model. If every team owns its own definitions without a review path, modularity turns into duplication with better folder names. If a central platform team owns every model, delivery slows down. The better balance is domain ownership with platform standards for naming, testing, contracts, and promotion paths. If you are still sorting out that boundary, this guide to understanding data platform architecture is a useful framing tool for who should own shared transformation layers versus local outputs.
The payoff is concrete. You spend less time reconciling numbers, less money rerunning broken jobs, and fewer sprint cycles rebuilding feature logic that should have been shared from the start.
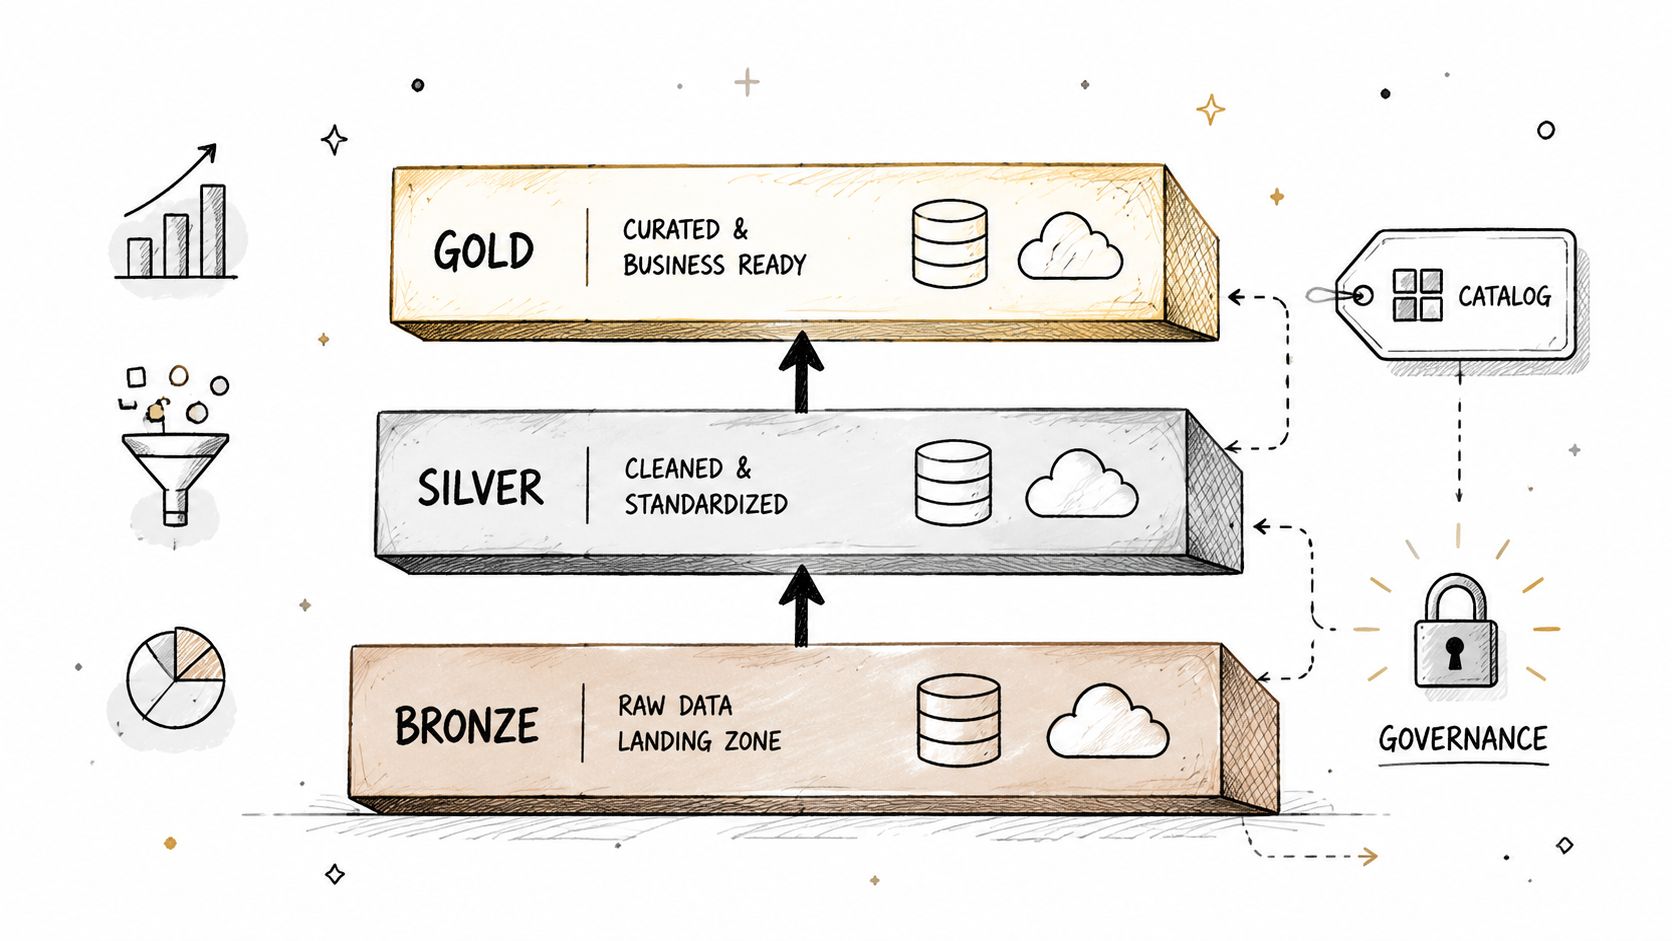
6. Data Lake and Warehouse Architecture Best Practices
A quarter after you launch an AI feature is a bad time to discover your storage design forces the team to choose between low-cost history, governed reporting, and low-latency serving. That trade-off shows up late, usually after data volume grows, finance starts asking where the warehouse spend went, and ML teams need event history you already compacted away.
The pattern that holds up in production is layered storage with clear intent. Raw data lands with minimal changes and a retention policy that supports replay. Validated and standardized data sits in a managed layer with schema controls and shared definitions. Curated serving layers exist for specific consumers such as BI, finance, compliance, product analytics, and model features. Lakehouse and medallion patterns work because they separate those concerns instead of forcing one schema to satisfy every workload.
What to optimize for
Query speed matters, but production architecture decisions usually fail on three other dimensions first: reprocessing, governance, and cost isolation. If you overwrite raw inputs too early, a business logic bug turns into a data recovery project. If every downstream team reads from the same semi-curated tables, one schema change can break finance reports, fraud models, and customer-facing features at the same time. If storage and compute are not separated by workload, your cheapest analytics use case can end up subsidizing your most expensive real-time one.
I usually advise CTOs to make one decision early: which workloads deserve warehouse guarantees, and which belong in lower-cost object storage with selective promotion into managed tables. Warehouses are good at concurrency, governed SQL access, and predictable analytics. Lakes are good at cheap retention, replay, and multi-format storage for training data, logs, and event history. The mistake is treating either one as the answer to everything.
A common failure pattern looks like this. A fintech team stores fraud features, compliance extracts, and finance reporting in the same "analytics" schema because it is faster in the first six months. Then a fraud team changes event grain, compliance needs seven-year retention, and finance needs stable monthly definitions. Now every release carries cross-team risk. Splitting storage into raw, validated, and business-owned serving layers reduces blast radius and makes ownership reviewable.
This is also where architecture choices connect directly to business metrics. Good layer boundaries cut rework when definitions change, reduce cloud spend by matching storage cost to access pattern, and shorten time-to-market for AI features because historical data remains reusable. Bad boundaries create hidden tax. Teams spend sprint time rebuilding extracts, backfilling broken tables, and arguing over whose schema broke the dashboard.
A simple scorecard helps:
- Low maturity: one warehouse schema handles reporting, ad hoc analysis, data science, and operational feeds
- Medium maturity: raw and curated zones exist, but retention, ownership, and promotion rules are inconsistent
- High maturity: storage tiers are mapped to workload type, replay is possible, serving layers have named owners, and cost controls exist by domain or consumer class
Your tool choices should follow those workload boundaries. For example, teams comparing dashboards for warehouse health, storage growth, and ingestion lag should choose based on operating model, not fashion. This comparison of Kibana vs Grafana for data platform monitoring is useful if your platform group is deciding how infrastructure and data signals will be viewed by engineering and operations.
If you are still deciding where shared storage standards end and domain ownership begins, this guide to understanding data platform architecture is a useful reference. It helps frame who should own raw foundations, who can publish curated serving layers, and where governance should sit so delivery does not slow down.
7. Monitoring, Alerting and Observability for Data Pipelines
At 6:45 a.m., your ELT run is green, finance opens the revenue dashboard, and the numbers are wrong. The warehouse loaded on time. A source sent partial data, one contract drifted, and no alert fired because the scheduler only checked task status. That is the gap observability has to close.
For a CTO, this is not a tooling discussion first. It is a production-readiness decision tied to revenue risk, on-call load, and how fast your team can ship AI features without losing trust in the underlying data. Teams that treat monitoring as "job succeeded or failed" usually discover problems from business users. Teams that instrument freshness, volume, schema, and business signals catch issues while they are still cheap to fix.
A practical scorecard looks like this:
- Low maturity: alerts fire only on task failure, dashboards show infrastructure health, and data incidents are reported by analysts or stakeholders
- Medium maturity: freshness and row-count checks exist for key tables, but ownership, thresholds, and escalation paths are inconsistent
- High maturity: technical and data health are monitored together, alerts map to owners and downstream impact, and incident review leads to threshold tuning or new checks
The minimum useful set of signals covers four failure modes:
- Freshness: data arrives late, stops arriving, or misses an expected update window
- Volume: row counts, file counts, or partition sizes move outside a normal range
- Schema: columns are added, dropped, renamed, or change type in ways that break consumers
- Business behavior: refund rate, conversion events, fraud tags, or other operating metrics shift in ways that suggest bad data, not just bad business performance
Here is the trade-off. Every extra check adds noise if you do not tune it, but too few checks create false confidence. I usually advise starting with pipeline paths that feed executive reporting, customer-facing workflows, and model training data. Those failures have the clearest cost. Once ownership is clear and alert quality improves, expand coverage to the rest of the estate.
A simple example: a daily revenue model completes on schedule, but one upstream source lands only half its records. Infra monitoring stays green. A volume check against a trailing baseline catches it. A downstream alert routed to the table owner and finance channel cuts detection time from hours to minutes.
Streaming systems fail differently. The service can stay up while event lag grows enough that recommendations or fraud decisions run on stale behavior. That hits conversion, risk, and user experience before anyone sees an error log. Observability for streaming data needs lag, freshness, and serving-side business checks, not just CPU and container health.
Tool choice matters less than coverage and operating model, but your dashboard layer still affects response time. If your platform team is choosing how to present infrastructure and pipeline signals to engineering and operations, this comparison of Kibana vs Grafana for data platform monitoring is a useful reference.
Good alerts are specific. They say what failed, which dataset or contract is affected, who owns it, what downstream assets are at risk, and what changed from normal. If your alert cannot answer those questions, it will train the team to ignore it.
8. Scalable Feature Engineering and Management
A team ships a promising churn model in six weeks. Three months later, nobody trusts the predictions because the training feature for "30-day product usage" does not match the online feature used at serving time. The model did not fail because of architecture. It failed because feature engineering was treated as notebook work instead of production infrastructure.
That distinction matters if you care about time-to-market for AI features. You can get the first model out quickly with ad hoc SQL and application-side logic. You cannot scale that approach across teams, use cases, and serving patterns without paying for it in rework, incident response, and model drift.
A production-ready feature system does four jobs well:
- Keeps point-in-time correctness: training sets reflect only the data available at prediction time
- Reuses feature definitions: the same logic is used across training, batch inference, and online serving where needed
- Assigns ownership: each feature has a clear owner, semantic definition, and list of downstream consumers
- Adds operating checks: freshness, null rates, and distribution shifts are checked before serving-critical workloads run
The trade-off is straightforward. A dedicated feature store can reduce duplication and training-serving skew, but it also adds platform cost, integration work, and another system your team has to operate. If you have one model in production, you may only need a shared feature registry, tested transformation code, and strict contracts around how features are defined. If you have several models, multiple teams, and real-time use cases, centralizing feature definitions usually pays for itself.
I look for one signal first. Can two teams compute the same business feature and get the same answer?
If the answer is no, your bottleneck is not model experimentation. It is feature governance.
Mini-case: a team used an AI coding agent to scaffold feature pipelines for churn prediction. Delivery sped up for a sprint. Then the review surfaced a deeper problem. Nobody could explain why training windows and online serving windows differed, or which downstream models depended on the generated logic. The fix was not to stop using AI assistance. The fix was to require feature contracts, lineage, reproducible backfills, and review steps similar to a software QA process for production changes.
For a CTO, this section should feed a simple decision matrix. If your roadmap depends on AI features tied to revenue, pricing, fraud, or personalization, hire or develop skills in feature design, data modeling, and ML platform operations before you buy more tooling. If your use cases are narrower, build the operating discipline first and keep the stack light. The business goal is not more feature infrastructure. It is lower model risk, faster iteration on useful features, and less engineering time spent reconciling conflicting definitions.
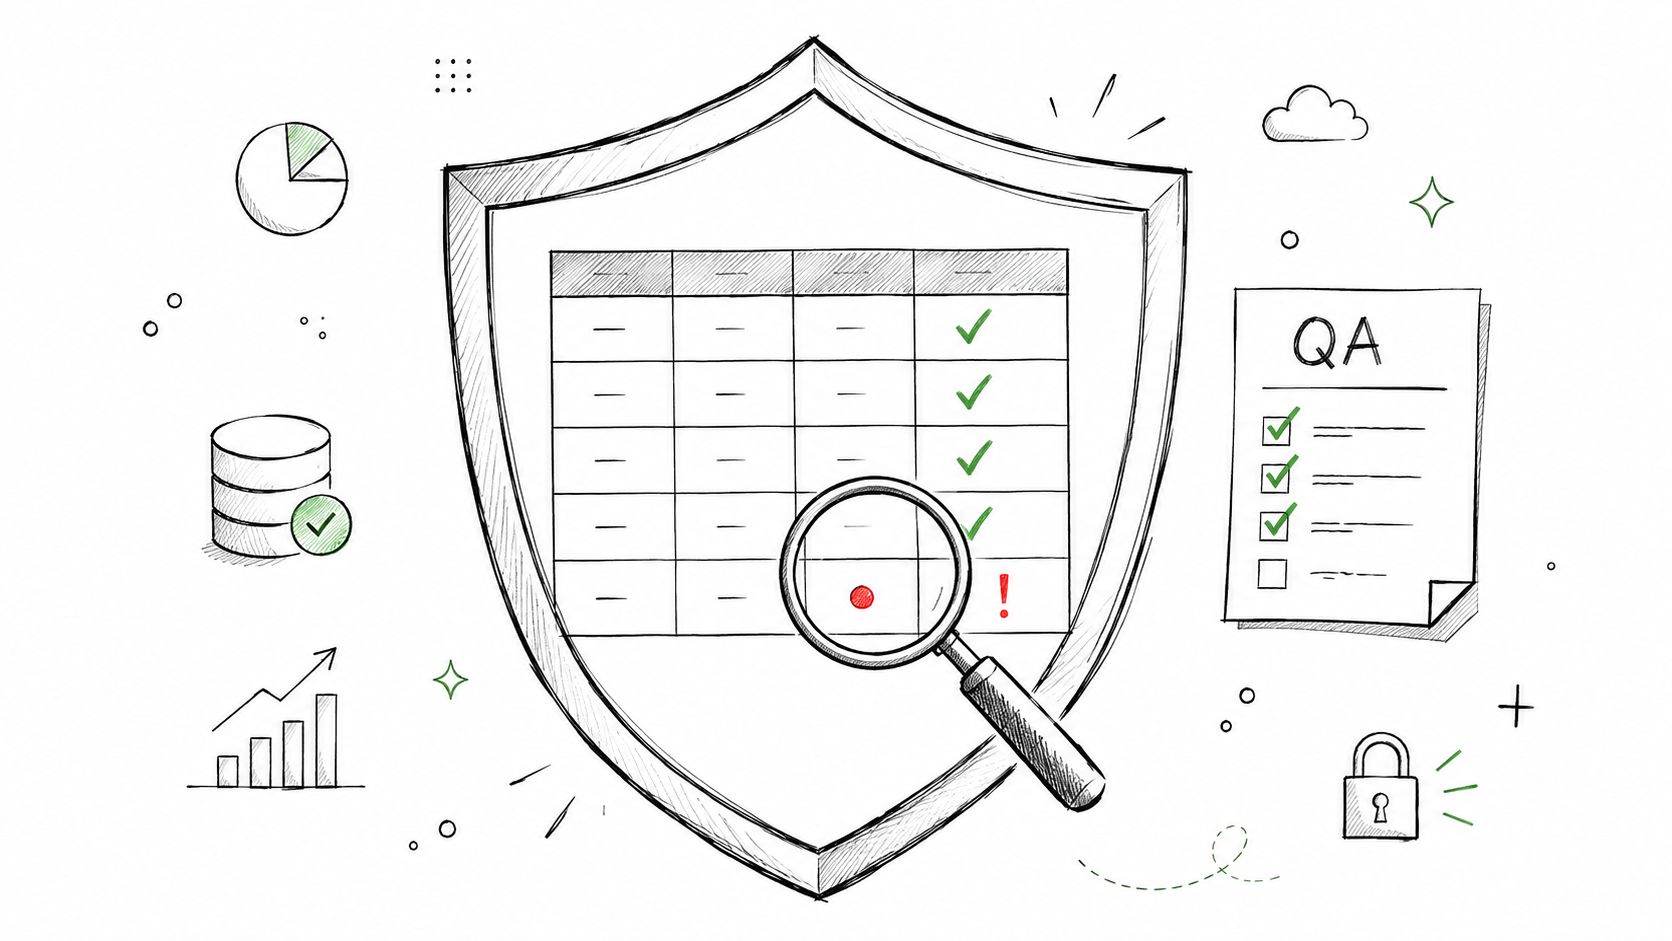
9. Testing and Quality Assurance in Data Pipelines
Testing in data systems is different from testing request-response applications. You're not only validating code paths. You're validating assumptions about shape, semantics, timing, and state across time. That means unit tests alone won't save you.
Strong data engineering best practices layer tests by failure mode. Unit tests cover transformation functions and macros. Integration tests validate source-to-warehouse behavior. End-to-end tests check whether a business output remains correct when the whole flow runs.
A practical testing stack
A useful pipeline testing setup often includes:
- Unit tests: custom macros, parsers, enrichment functions, dedupe logic
- Schema tests: expected columns, uniqueness, not-null, accepted values
- Integration tests: realistic fixtures across ingestion and transformation boundaries
- Regression tests: snapshot outputs for core business metrics before merge
Mini-case: a fraud rule pipeline still passes schema tests after a source app changes enum values. The model input table exists, but the semantic mapping is wrong. Only an integration test with fixture records catches the issue.
Another example is a backfill. Your SQL compiles, but historical rows violate assumptions around null handling and key uniqueness. A representative backfill test in staging exposes the bug before you touch production partitions.
If your org is still building the broader habit of release quality, this article on quality assurance for software testing teams is relevant because many of the review and automation disciplines transfer directly.
Testing slows down reckless shipping. It speeds up everything else.
10. Documentation and Knowledge Management for Data Systems
A pipeline fails at 11:40 p.m. on quarter close. The warehouse is up, the jobs are retrying, and your team still cannot answer three basic questions: what changed, who owns the broken dataset, and which executives will see the impact in the morning. That is a documentation failure, not just an operations failure.
Useful documentation reduces time-to-recovery, prevents repeat incidents, and lowers the cost of onboarding new engineers. It also protects delivery speed for AI features. If your team has to reverse-engineer feature definitions, lineage, or ownership every time a source changes, model work slows down and release risk goes up.
The standard is simple. Document the parts of the system that people need under pressure and during change.
The docs worth maintaining
Keep these current:
- Runbooks: first checks for freshness failures, schema drift, late-arriving data, and broken downstream dependencies
- Data dictionaries: field definitions, business logic, owners, known caveats, and fields that should not be repurposed
- Architecture decision records: why you chose batch or streaming, managed or self-hosted orchestration, SCD Type 1 or Type 2, and what trade-offs came with that choice
- Consumer-facing lineage notes: upstream systems, downstream consumers, refresh expectations, and approval paths for breaking changes
- Service ownership records: the Slack channel, on-call team, escalation path, and business owner for each critical dataset
- Change logs: schema changes, deprecations, contract updates, and migration deadlines
Data contracts belong here too. The point is not more paperwork. The point is to make change impact explicit before deployment.
A practical rule works well. Minor additive changes, such as a new optional event property, should usually warn and pass. Breaking changes, such as deleting a field used by finance reporting or fraud scoring, should block release until owners approve the change and downstream fixes are ready. The contract, the owner, and the runbook should all agree.
I have seen teams invest heavily in catalogs and still miss the business value because nobody defined operating expectations. A polished glossary helps less than a plain runbook that tells an on-call engineer how to verify source delivery, identify the affected models, and communicate blast radius in ten minutes.
If you want a scorecard for production readiness, review each critical dataset against these questions:
- Is there a named technical owner and business owner?
- Is the refresh SLA documented?
- Are breaking fields and contract rules defined?
- Is downstream impact visible before schema changes ship?
- Is there a runbook with recovery steps that have been tested?
- Can a new engineer understand the dataset without asking for a meeting?
If you cannot answer yes to most of those, documentation is still a hidden delivery risk.
The trade-off is maintenance overhead. Documenting every table in full detail wastes time. Documenting revenue, customer, compliance, and model-input datasets pays for itself quickly. Start with the systems where downtime, bad data, or ambiguity creates real cost. That is how documentation becomes part of your production-readiness framework instead of a forgotten side project.
Data Engineering Best Practices, 10-Point Comparison
| Item | Implementation Complexity 🔄 | Resource Requirements ⚡ | Expected Outcomes 📊⭐ | Ideal Use Cases 💡 | Key Advantages ⭐ |
|---|---|---|---|---|---|
| Data Pipeline Orchestration & Workflow Management | High, complex DAGs, scheduling, retries | Medium–High, orchestration infra, SRE/DevOps skills | Automated, reliable pipelines with clear dependencies | Multi-stage ETL/ELT, cross-system scheduling, production ML | Scalability, visibility, dependable retries and dependency handling |
| Data Quality & Validation Frameworks | Medium, rules, statistical checks, tuning | Medium, compute for checks, domain expertise | Fewer bad-data incidents; improved model reliability | Critical model inputs, multi-source ingestion, compliance-sensitive data | Early detection of anomalies, compliance support, trust in data |
| Version Control & Data Lineage Management | Medium–High, cross-system integration, instrumentation | Medium, storage for lineage, connectors, tooling | Reproducibility, faster debugging, impact/traceability | Regulated environments, complex transformations, audits | Full traceability, reproducible analyses, impact analysis |
| Infrastructure as Code (IaC) for Data Systems | Medium, learning IaC patterns and modules | Medium, infra provisioning, CI/CD, ops skills | Repeatable, auditable deployments with reduced configuration drift | Multi-env deployments, distributed teams, DR/recovery planning | Consistency, automation, auditable and reversible infra changes |
| Modular Data Transformation Design | Medium, upfront design and interfaces | Low–Medium, dev effort, testing harness | Reusable, testable modules; reduced technical debt | Large codebases, many contributors, dbt-style SQL transforms | Reuse, simpler testing, faster onboarding and refactoring |
| Data Lake & Warehouse Architecture Best Practices | High, architecture, governance, optimization | High, storage/compute, skilled data engineers | Scalable, performant analytics and ML-ready datasets | Petabyte-scale analytics, mixed batch & streaming workloads | Scalability, cost efficiency, flexibility across use cases |
| Monitoring, Alerting & Observability for Data Pipelines | Medium, instrumentation and threshold tuning | Medium–High, monitoring stack, alerting channels | Faster detection/MTTR; proactive issue prevention | Production pipelines, SLA-bound workflows, 24/7 ops | Real-time visibility, SLA enforcement, reduced downtime |
| Scalable Feature Engineering & Management | High, feature store design, point-in-time correctness | High, feature infra, governance, engineering effort | Faster model iteration; consistent training/serving features | Large ML teams, many models, real-time feature serving | Feature reuse, consistency, reduced training/serving skew |
| Testing & Quality Assurance in Data Pipelines | Medium, many test types and data scenarios | Medium, CI, test data, compute for snapshots | Fewer regressions; safer refactors; higher confidence in changes | Frequent deployments, complex transforms, critical data paths | Regression protection, faster debugging, implicit documentation |
| Documentation & Knowledge Management for Data Systems | Low–Medium, process discipline and tooling | Low–Medium, time investment, catalogs/wiki tools | Faster onboarding; reduced institutional knowledge loss | Remote teams, high turnover, compliance and audits | Asynchronous collaboration, discoverability, audit support |
Your Next 3 Steps to Production-Ready Data
You won't implement all 10 practices at once. You shouldn't try. The teams that succeed pick the control that reduces the most business risk first, then harden outward from there.
Start with a quick maturity score. You need a baseline across orchestration, quality, testing, observability, lineage, and documentation. Don't overcomplicate it. Mark each area red, yellow, or green based on whether it's ad hoc, partially standardized, or consistently enforced. If your fraud model depends on stale features, observability is probably red. If every schema change requires Slack archaeology, lineage and contracts are red.
Second, choose the single practice tied to your highest-cost failure mode. That might be data quality if finance numbers keep drifting. It might be orchestration if engineers still rerun jobs by hand. It might be documentation if incidents stall because nobody knows dataset ownership. Tie that choice to a concrete business outcome such as lower incident risk, faster AI feature delivery, or less rework during audits.
Third, run a focused 2-week pilot with a senior data engineer. Don't “improve the platform.” Pick one pipeline or domain and make the change visible. Examples include adding freshness and schema checks to your revenue pipeline, moving a fragile cron chain into Airflow, or introducing lineage and contracts for model features that feed production inference. A short pilot gives leadership something better than a roadmap. It gives proof that the operating model works.
If hiring is the bottleneck, decide whether you need a builder, an operator, or a multiplier. A builder can design the pipeline or platform from scratch. An operator can stabilize incidents, observability, and cost. A multiplier can establish standards, review AI-assisted changes, and coach the team into repeatable delivery. Early-stage companies often need one person who can do all three well enough, then split the role later.
That hiring decision matters more now because data teams are changing shape. AI-assisted development can increase output, but it also increases the need for review discipline, lineage clarity, and incident readiness. Faster code generation doesn't remove the need for staff-level judgment. It makes that judgment more important.
If you want outside help, ThirstySprout is one option to evaluate for finding senior data engineering talent that can work on production systems, not just prototypes. The right engagement is usually narrow at first. One critical pipeline, one concrete reliability target, one measurable improvement.
Ready to move? Download or create a simple maturity checklist, identify the riskiest gap, and scope a short implementation pilot. That's how you turn data engineering best practices from a nice list into a system your business can rely on.
If you need senior data engineers who can harden pipelines, set up observability, and support AI product delivery, ThirstySprout can help you evaluate vetted remote talent quickly. You can start with a focused pilot, review sample profiles, and bring in the exact level of expertise you need for your stack.
Hire from the Top 1% Talent Network
Ready to accelerate your hiring or scale your company with our top-tier technical talent? Let's chat.