
TL;DR: Key Takeaways
- What it is: Continuous performance testing automates performance checks within your CI/CD pipeline, making it a mandatory quality gate, not a pre-release chore.
- Why it matters: It prevents performance regressions, reduces debugging time, and ensures a consistently fast user experience, directly protecting revenue and customer trust.
- How to start: Pick one critical API endpoint. Define a clear P99 latency and error rate Service Level Objective (SLO). Use a tool like k6 or Locust to build a fast-running test.
- Key action: Automate this test to run on every pull request. Set a threshold to automatically fail the build if the SLO is breached.
- Business impact: A 100ms slowdown can cut conversions. Continuous testing catches these issues early, preventing churn and enabling faster, more confident feature releases.
Who this guide is for
This guide is for CTOs, Heads of Engineering, and MLOps leads who need to ensure their AI applications remain fast and reliable as they scale. If you are responsible for architecture decisions, team productivity, or system uptime, this framework will help you move from reactive fire-fighting to proactive performance management.
The 90-Day Framework for Continuous Performance Testing
This is a step-by-step plan to implement an automated performance testing strategy in one quarter. It’s about delivering value at each stage, not boiling the ocean.
Following this framework transitions performance from a manual project into a daily, automated process.
Practical Example 1: GitLab CI Config for a k6 Test
Here’s a concrete example of how to automate a k6 performance test in a GitLab CI/CD pipeline. This configuration runs a load test on every merge request, automatically failing the build if performance degrades.
The key is the thresholds setting within your your-test-script.js file, which defines the pass/fail criteria. If P99 latency exceeds 200ms or the error rate is over 1%, k6 exits with an error code, failing the CI job and blocking the merge.
Your .gitlab-ci.yml file:
stages:- testperformance_test:stage: testimage:name: grafana/k6:latestentrypoint: ['']script:- echo "Running k6 performance test..."- k6 run --out json=k6-results.json your-test-script.jsartifacts:paths:- k6-results.jsonrules:- if: $CI_PIPELINE_SOURCE == 'merge_request_event' && $CI_MERGE_REQUEST_TARGET_BRANCH_NAME == 'main'This YAML snippet turns your CI/CD pipeline into an active performance guardian, enforcing your SLOs on every code change.
Practical Example 2: Mini-Case Study of Triage Workflow
An MLOps team at an e-commerce company receives a Slack alert: "🔥 Performance Regression Detected in PR #1234: p99_latency is 410ms, exceeding baseline of 250ms (+64%)."
- Investigation: The on-call engineer clicks the link in the alert, which opens a Grafana dashboard. It shows a clear latency spike for the test run of PR #1234.
- Diagnosis: She pivots to the resource utilization dashboard for the same run and sees a corresponding spike in GPU memory usage.
- Root Cause: Inspecting the code in PR #1234, she finds a developer updated the model to a new, larger version that was too big for the GPU's VRAM, causing slow memory swapping.
- Resolution: The engineer posts a screenshot on the PR, explains the issue, and tags the developer. The developer reverts to the smaller model, the performance test passes, and the regression is fixed in under 30 minutes, never impacting a customer.
This workflow shows how connecting alerts to dashboards enables rapid, data-driven triage.
Deep Dive: Common Pitfalls and Best Practices
Why You Must Define Clear Metrics
Vague goals like "the app needs to be fast" make performance testing useless. You need a hierarchy of metrics that connect directly to business outcomes. A 100ms slowdown isn’t just a technical detail; it's a potential drop in user engagement.
Start by separating metrics into two categories:
- Service-Level Metrics (The "What"): These measure what the user experiences. Your Service Level Objectives (SLOs) must be based on these. Examples include P99 latency and error rate.
- Resource-Level Metrics (The "How"): These are diagnostic, tracking underlying infrastructure like CPU/GPU utilization or memory consumption. They help you find the why behind a service-level problem.
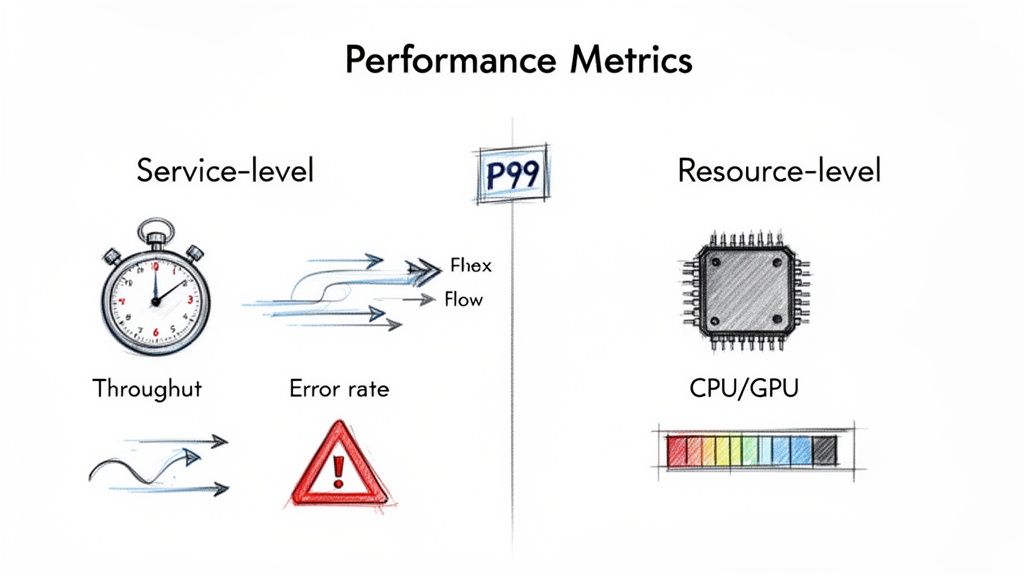
alt text: A diagram showing two categories of performance metrics. Service-level metrics include throughput, error rate, and P99 latency. Resource-level metrics include CPU utilization, GPU utilization, and memory usage. An arrow points from resource-level to service-level, indicating that resource metrics explain service-level outcomes.
Trade-off: Don't track average latency. It’s a vanity metric that hides problems affecting real users. Focus on tail latencies like P95 (the experience for 95% of users) and P99 (the experience for your unhappiest 1%). This provides a much more honest view of system reliability.
Building Your Test Harness and Data Strategy
Your test harness is more than just a script; it’s the entire framework for running repeatable tests. The key is to balance feedback speed with test depth.
- Commit-Level Smoke Tests (Under 5 mins): Run on every pull request to catch disastrous regressions on a critical path before code is merged.
- Nightly Regression Suites (1-2 hours): Run daily on the main branch to cover a wider range of user flows and spot subtle slowdowns against a baseline.
- Pre-Release Soak Tests (4+ hours): Run before a major release to find endurance issues like memory leaks that only appear under sustained load.
Your AI is only as good as your test data. Testing a RAG system with "lorem ipsum" is useless. Use anonymized production data or realistic synthetic data. Most importantly, version your test data with a tool like DVC (Data Version Control) or Git LFS to ensure every performance test is repeatable and comparable.
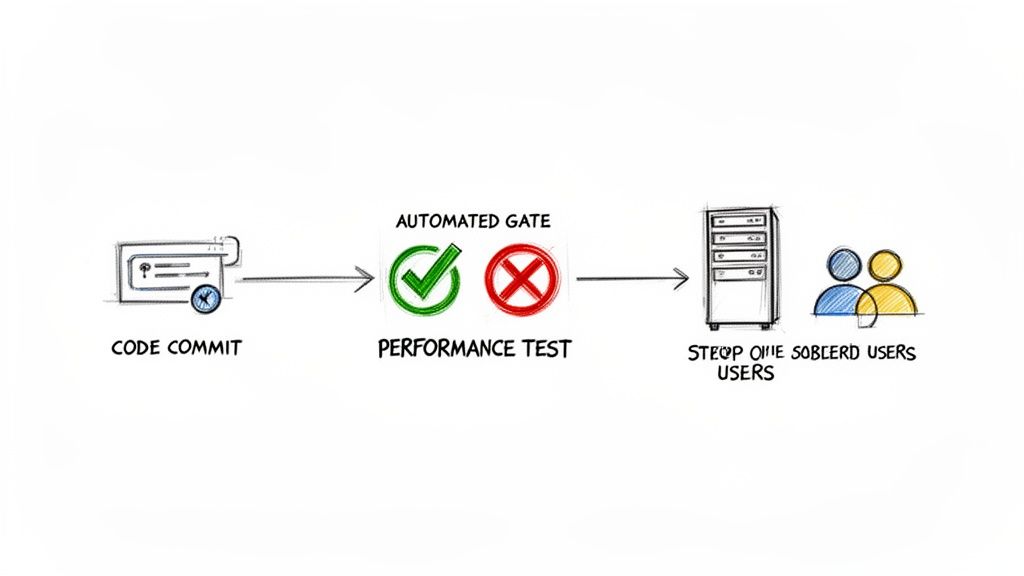
alt text: A workflow diagram of continuous performance testing. A developer commits code, which triggers an automated performance test in the CI/CD pipeline. If the test passes, the code is deployed; if it fails, the build is blocked.
The Biggest Mistake: Skipping the Baseline
The most common failure mode is running a test, getting a number, and having no context. Is 300ms good or bad? Without a baseline, the number is meaningless.
Before automating anything, run your test suite against a stable environment at least 5–10 times. This captures normal variance. A reliable threshold is to flag any result that deviates by more than two standard deviations from the baseline average. This statistical approach filters out noise and ensures that when an alert fires, it’s for a real problem.
Checklist: Getting Started with Continuous Performance Testing
Use this checklist to ensure you have the core components in place for a successful rollout.
Phase 1: Foundation (First 30 Days)
- Identify the single most critical user journey or API endpoint.
- Define one clear, measurable SLO for that journey (e.g., P99 latency < 400ms).
- Select a lightweight load testing tool (k6 or Locust).
- Create a test script with realistic test data.
- Run the test 10+ times manually to establish a statistical baseline.
Phase 2: Integration (Next 30 Days)
- Add the test script as a job in your CI/CD pipeline.
- Configure the job to run automatically on merge/pull requests.
- Set a hard failure threshold in the test script or CI job.
- Configure an automated alert to a team channel (e.g., Slack) for test failures.
Phase 3: Scaling (Final 30 Days)
- Expand test coverage to the next two most important user journeys.
- Create a Grafana dashboard to visualize performance trends over time.
- Review and tune your SLOs based on the data you've collected.
- Document your triage workflow for handling performance alerts.
What To Do Next
- Schedule a 30-minute meeting with your team. Identify the single most critical user path to protect with your first performance test.
- Assign an owner. Task one engineer with creating a simple k6 or Locust script and establishing a manual baseline within the next two weeks.
- Hire the right expertise. If your team lacks deep CI/CD and performance engineering skills, consider bringing in vetted talent. We can connect you with MLOps engineers from our talent network who have built these systems before.
Ready to build a high-performing AI team that understands these principles? With ThirstySprout, you can hire vetted AI and MLOps engineers in days, not months. Start a Pilot Today.
References and Further Reading
- Case Study: TCE Document Intelligence
- ThirstySprout: AI Governance Best Practices
- ThirstySprout: Automating Regression Testing
- ThirstySprout: Machine Learning Model Deployment Tools
- Market Data: Performance Testing Market Growth (Cognitive Market Research)
- Market Data: Continuous Testing Market Trends (Mordor Intelligence)
- Tools: k6, Locust, Grafana, PagerDuty
Hire from the Top 1% Talent Network
Ready to accelerate your hiring or scale your company with our top-tier technical talent? Let's chat.