
TL;DR: Your First 90 Days with Big Data
- Your Goal: Turn raw retail data into measurable revenue or cost savings within one quarter. Don't boil the ocean.
- First Project: Start with customer segmentation. It's high-impact, low-risk, and directly improves marketing ROI.
- Tech Stack: Use pay-as-you-go cloud services. An initial stack could be Fivetran for data ingestion, Amazon S3 for storage, and Snowflake for warehousing.
- Team: Hire a fractional Data Engineer first to build your data pipelines. Add a Data Scientist once the data is clean and accessible.
- Next Step: Use our checklist below to scope a 90-day pilot project that delivers a tangible win.
Who This Is For
This guide is for operators who need to deliver results, not theory.
- CTO / Head of Engineering / Staff Engineer: You need to decide on a scalable data architecture and choose between platforms like Snowflake vs. Databricks. This guide provides a reference architecture and decision framework.
- Founder / Product Lead: You're scoping AI features and building the business case for investing in big data in retail. This guide helps you prioritize high-ROI projects like personalization or demand forecasting.
- Talent Ops / Procurement: You're evaluating the talent required to build these systems. This guide clarifies the key roles and when to hire them.
A 3-Phase Framework for Implementing Big Data in Retail
Jumping into big data is a journey, not a single project. Approach it in deliberate, value-driven phases to build momentum and prove ROI. Each phase builds on the last, ensuring you have a solid foundation before adding complexity.
Phase 1: Foundation and Quick Wins (Months 0–3)
The first 90 days are about focus. Zero in on one high-impact pilot project and gather only the core data needed to make it happen.
- Establish a Data Foundation: Centralize your most important data sources, like customer profiles from your CRM and transaction data from your POS or e-commerce platform. The goal is to create a single source of truth for your pilot.
- Launch a High-ROI Pilot: Pick a project with a clear, measurable outcome. A customer segmentation analysis is a fantastic starting point. It’s relatively quick and directly feeds into marketing personalization.
- Define Success Metrics: Know what success looks like from day one. For a segmentation project, track conversion rates on targeted email campaigns or the lift in average order value (AOV) for specific customer groups.
Phase 2: Scaling and Prototyping (Months 3–9)
With an initial win, expand your scope. This phase is about scaling up your data infrastructure and tackling a predictive project.
- Onboard More Data Sources: Pull in richer context from web browsing behavior, app analytics, and even unstructured data like customer reviews.
- Build a Predictive Prototype: Develop a prototype for a more advanced use case, like a real-time recommendation engine, using machine learning to suggest products.
- Create an MLOps Baseline: Introduce basic Machine Learning Operations (MLOps). This means versioning your datasets and models and setting up a basic CI/CD pipeline to automate model training and deployment.
Phase 3: Automation and Optimization (Months 9+)
Now you operationalize your models and automate decision-making across the business.
- Deploy to Production: Move your recommendation engine or demand forecasting model from a prototype into a live production environment.
- Integrate and Activate: Push the intelligence from your models back into the tools your teams use every day. Sync customer segments to your marketing platform or trigger low-stock alerts for store managers.
- Monitor and Refine: Continuously monitor model performance against your business KPIs. Set up alerts for concept drift and establish a process for retraining models to maintain accuracy.
2 Practical Examples of Big Data in Retail
It’s one thing to talk about big data in the abstract. Here are two real-world examples showing its impact on the bottom line.
Example 1: E-commerce Recommendation Engine (to increase AOV)
An online apparel store wanted to increase its Average Order Value (AOV) by moving beyond generic "popular items" banners.
They built a hybrid recommendation engine combining two techniques:
- Collaborative Filtering: Suggests items based on the behavior of similar shoppers.
- Content-Based Filtering: Matches product attributes (brand, color, style) to a user's known preferences.
This approach solves the "cold start" problem (what to show a new visitor) while providing relevant suggestions to loyal customers.
Here's a simplified look at the architecture:
This diagram shows how user behavior data and product information are processed by a hybrid machine learning model to generate real-time product recommendations for the e-commerce site.
User actions were streamed via Apache Kafka and processed in near real-time with Spark Streaming.
The result: After a 90-day pilot, the company saw a 15% lift in AOV from customers who interacted with the new recommendation features. According to this in-depth market analysis, real-time personalization contributes a +2.1% boost to the retail market's overall growth.
Example 2: Demand Forecasting for 50+ Stores (to cut costs)
A regional retail chain struggled with frequent stockouts of best-sellers while overstocking other items. Their old forecasting method relied solely on past sales, ignoring external drivers.
Their data science team built a new model using Facebook's Prophet, integrating several new data sources:
- Local school calendars and public holidays
- Regional weather forecasts
- Internal promotional schedules
This allowed them to predict demand at the individual store level, optimizing inventory across their entire network.
Model Accuracy Scorecard
| Metric | Old Model (Historical Only) | New Model (Integrated Data) | Improvement |
|---|---|---|---|
| Mean Absolute % Error | 22.5% | 13.0% | -9.5 pts |
| Forecast Bias | -8.0% (Under-forecasting) | -1.5% | +6.5 pts |
| Lost Sales from Stockouts | $1.2M (Annualized) | $960k (Annualized) | -20% |
The business impact was clear and immediate: a 20% reduction in lost sales due to stockouts and a 10% drop in inventory carrying costs.
The Deep Dive: Trade-offs, Use Cases, and Pitfalls
What Big Data in Retail Really Means
Big data isn't a static collection of sales reports. It’s a live flow of information from customer clicks, inventory scans, and market trends, used to make intelligent, automated decisions. It’s the shift from asking, "What happened last quarter?" to answering, "What should we do in the next five minutes?" To see how this works in practice, this guide on Marketing Analytics in Retail shows exactly how data drives modern strategies.
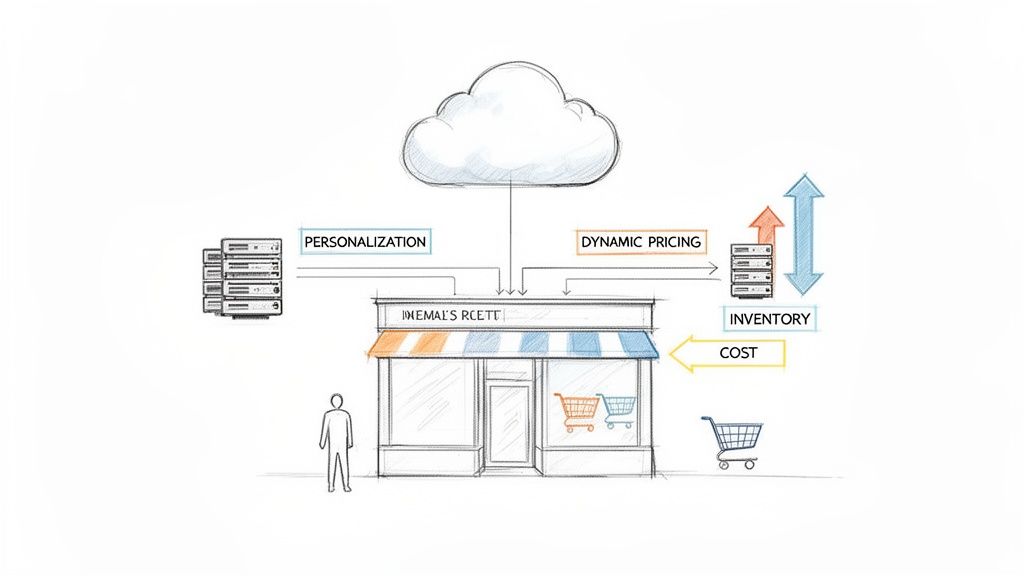
This diagram shows the central role of a big data system, which processes signals from various retail operations to automate decisions on pricing, inventory, and customer experience.
For a technical leader, the mission is to build systems, not reports. The real win comes from using data to automate price changes, personalize product recommendations, and flag a stockout before it ever happens—all without human intervention.
Core Use Cases Driving Retail Growth
The global big data analytics market in retail is projected to grow from $4.2 billion in 2019 to $14.1 billion by 2026, a 23.4% compound annual growth rate (CAGR), according to these retail market trends. This growth is driven by a few core applications.
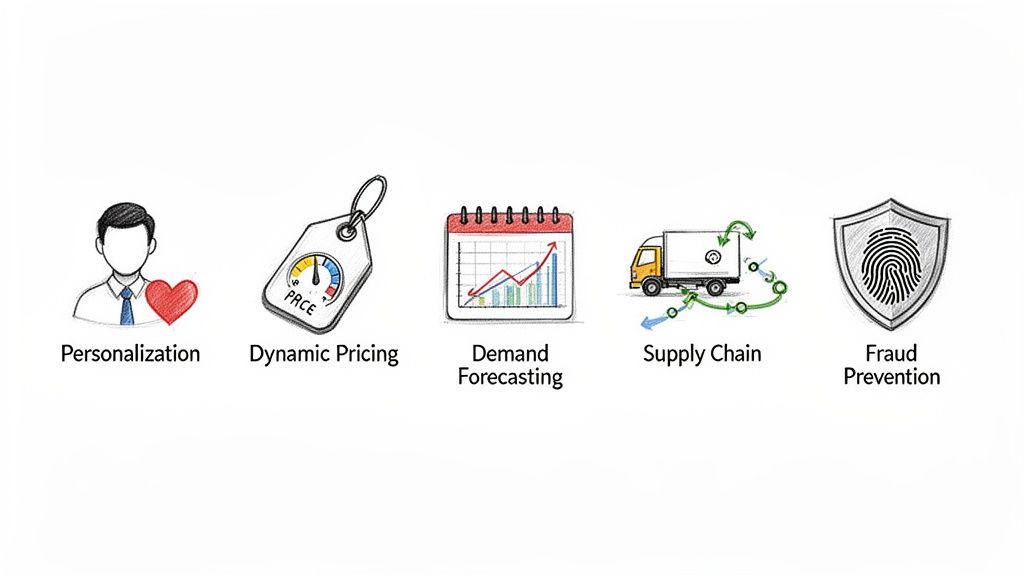
These five applications represent the highest-impact areas where big data can drive measurable business value in retail.
- Hyper-Personalization: Use browsing history, past purchases, and real-time behavior to create 1:1 product recommendations. This directly impacts Conversion Rate, Average Order Value (AOV), and Customer Lifetime Value (CLV).
- Dynamic Pricing: Automate price adjustments based on competitor prices, demand, and inventory levels to protect margins. Key metrics are Gross Margin and Inventory Turn.
- Demand Forecasting: Use time-series models like ARIMA or Prophet with external data (weather, holidays) to predict sales and optimize stock levels. Track Forecast Accuracy and Stockout Rate. For more on this, see our guide on data analysis techniques.
- Supply Chain Optimization: Gain end-to-end visibility by integrating data from carriers, Warehouse Management Systems (WMS), and ERP systems to spot bottlenecks. Measure On-Time-In-Full (OTIF) Delivery and Cost Per Shipment.
- Real-Time Fraud Prevention: Use machine learning to analyze transaction and behavioral data to block fraudulent orders before they are processed, reducing your Chargeback Rate.
Your Retail Data Architecture and Tech Stack
A great strategy is useless without the right engine. Building a robust data platform is your biggest technical challenge. This starts with a modern data management strategy.
The diagram below shows how different applications are powered by a modern data architecture.
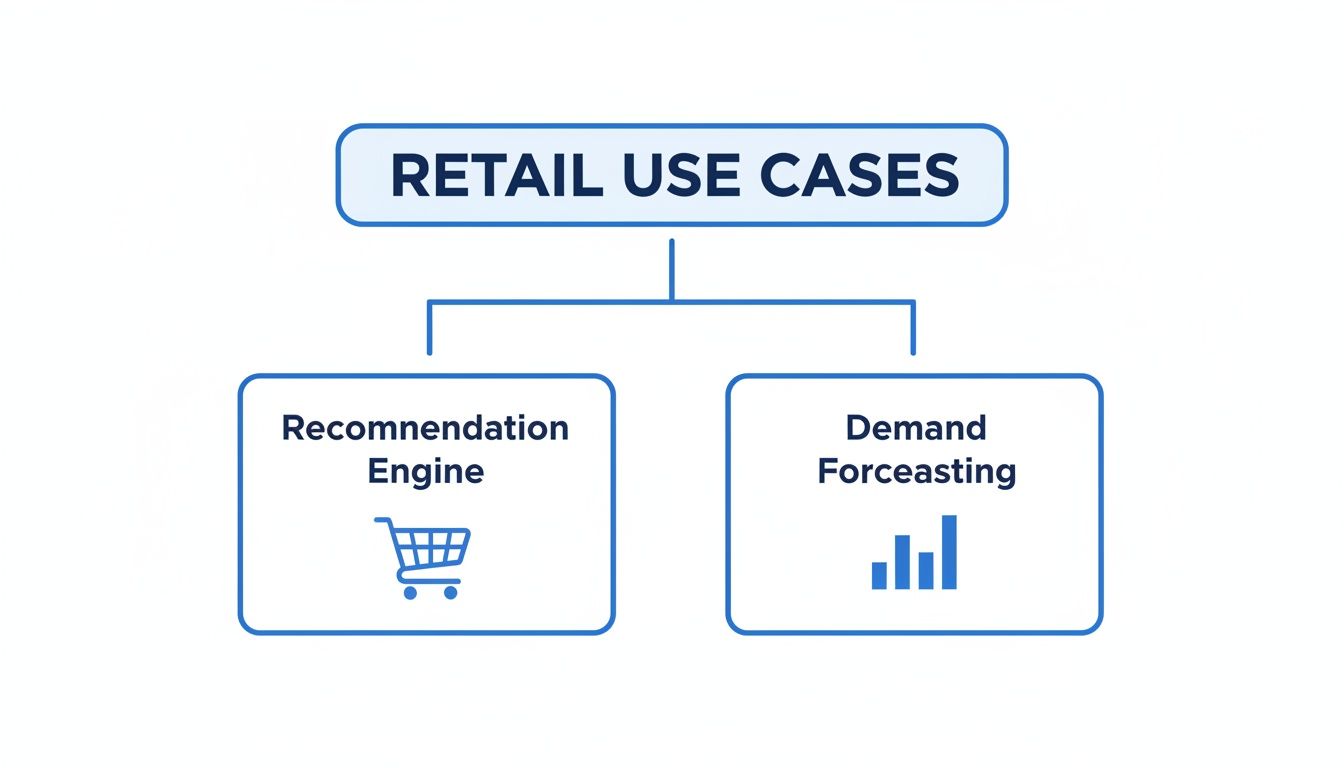
This diagram illustrates how a central data architecture supports specific retail applications like recommendation engines and demand forecasting, turning data into business outcomes.
When building this system, you have two main paths: an all-in-one platform or a composable stack.
- An all-in-one platform like Databricks offers a tightly integrated solution. It's faster to set up but can lead to vendor lock-in.
- A composable stack lets you pick the best tool for each job (e.g., Fivetran for ingestion, Snowflake for storage, dbt for transformation). This offers more flexibility but requires more integration effort.
For most growing businesses, a composable stack is the better long-term choice. Our guide to the best data pipeline tools is a great place to start.
Common Pitfalls and How to Avoid Them
- What’s the real cost of a pilot? Budget $30,000 to $70,000 for a 2-4 month pilot. This covers fractional talent (a Data Engineer and Data Scientist) and pay-as-you-go cloud tools like Amazon S3, Databricks, or Snowflake. Avoid a $500k+ big-bang project.
- Who do I actually need to hire? Start with a Data Engineer. They build the foundational pipelines that make everything else possible. Once your data is clean and accessible, hire a Data Scientist or ML Engineer to build models. For early projects, fractional experts are more cost-effective. We can help you hire remote AI engineers with production experience.
- How do we handle data privacy? This is non-negotiable. Use a Customer Data Platform (CDP) to manage user consent. Ensure compliance with regulations like GDPR and CCPA from day one. Anonymize and encrypt data as standard practice. Understanding the connection between big data and security is critical.
Checklist: Scoping Your First Retail Data Pilot
Use this checklist to define a 90-day pilot project that delivers a measurable win. This ensures you focus on business impact, not just technology.
1. Define the Business Problem & Goal
- What specific business metric are you trying to move? (e.g., Increase AOV by 10%, reduce stockouts by 15%)
- Which use case has the clearest path to this goal? (e.g., Customer Segmentation, Demand Forecasting for one product category)
- Who is the executive sponsor for this pilot?
2. Identify Data Sources & Availability
- What are the 2-3 core data sources needed? (e.g., Shopify transaction data, Google Analytics clickstream)
- Who owns these data sources?
- Is the data accessible via API, database connection, or file export?
3. Scope the Technical Build
- Where will the data be stored? (e.g., Amazon S3 data lake)
- What tools will be used for processing? (e.g., Snowflake, Databricks)
- What is the final output? (e.g., A dashboard in Tableau, a CSV of customer segments for the marketing team)
4. Define the Team & Budget
- What roles are required? (e.g., 1 part-time Data Engineer, 1 part-time Data Scientist)
- What is the estimated budget for talent?
- What is the estimated budget for cloud tools?
5. Measure Success
- What is the primary Key Performance Indicator (KPI)?
- How will you measure it before and after the pilot? (e.g., A/B test, pre/post analysis)
- What does a successful outcome look like in 90 days?
What to Do Next
- Scope Your Pilot: Use the checklist above to define your first 90-day project. Focus on a single, measurable business outcome.
- Assemble Your Team: Identify the fractional data engineer and/or data scientist needed to execute the pilot.
- Book a Scoping Call: We match you with vetted AI and data experts who have shipped these systems before. A pilot can be live in 2–4 weeks.
Building a team with production-grade experience in big data in retail is critical. Start a Pilot.
References
- Big Data Analytics in Retail Market by Component, Deployment Model, Organization Size and Application: Global Opportunity Analysis and Industry Forecast, 2021-2027. Allied Market Research.
- Big Data Analytics In Retail Market - Size, Share, & Trends Analysis. Mordor Intelligence.
- Prophet: Automatic Forecasting Procedure. Facebook Research.
- What Is ERP (Enterprise Resource Planning)? Oracle NetSuite.
Hire from the Top 1% Talent Network
Ready to accelerate your hiring or scale your company with our top-tier technical talent? Let's chat.